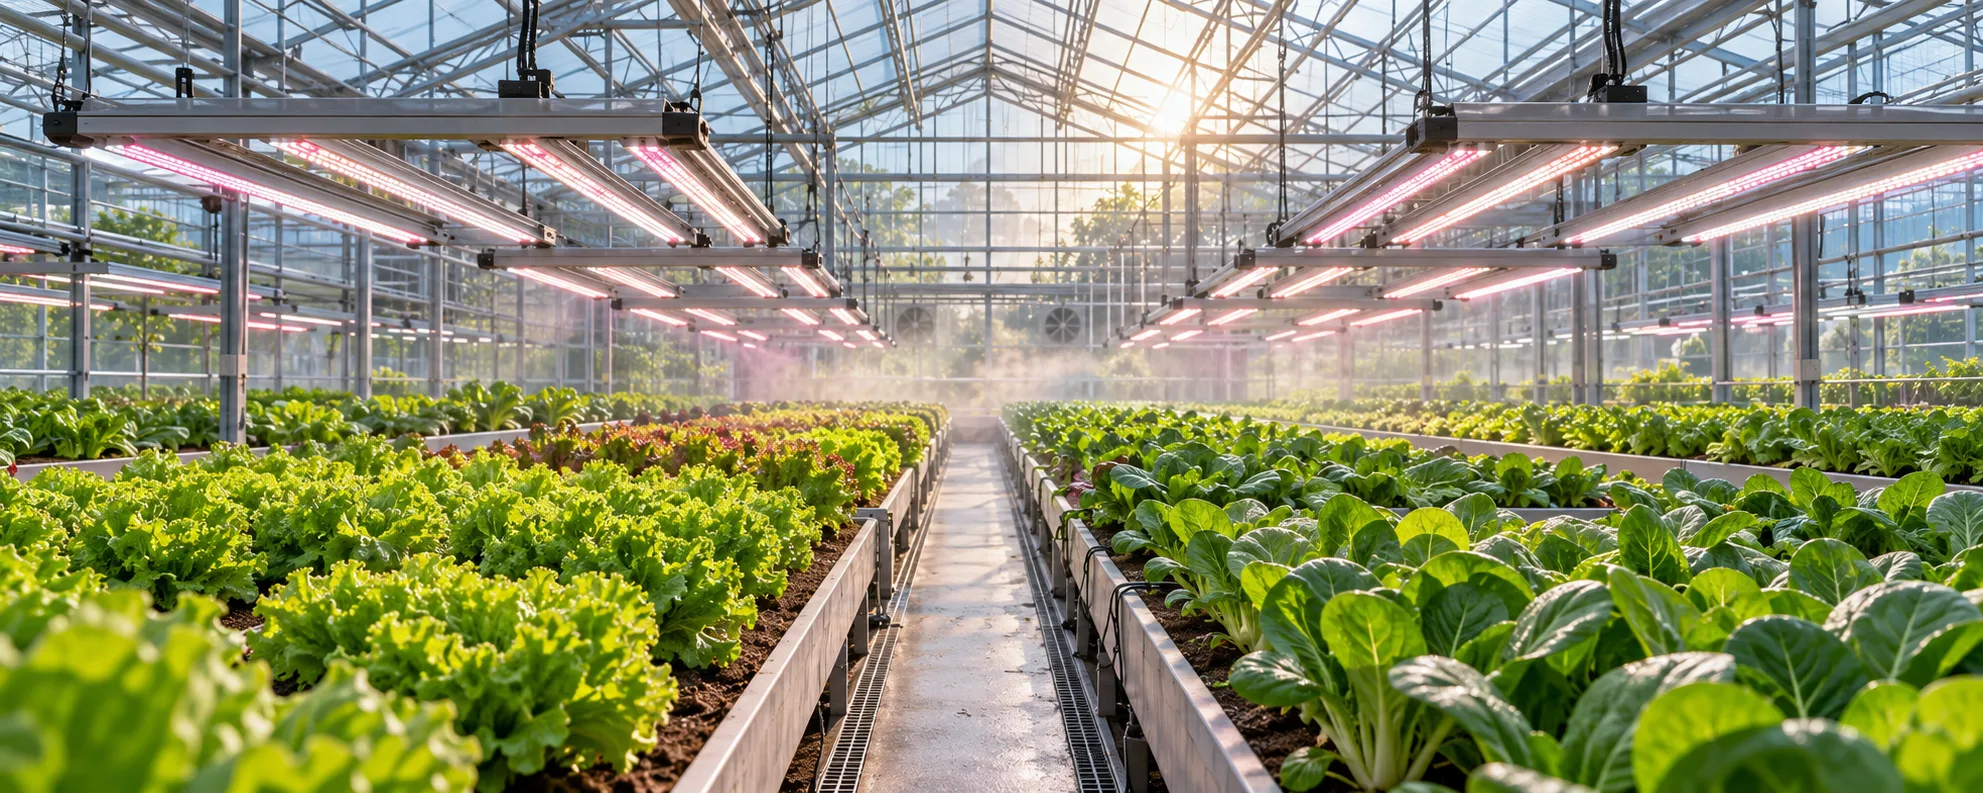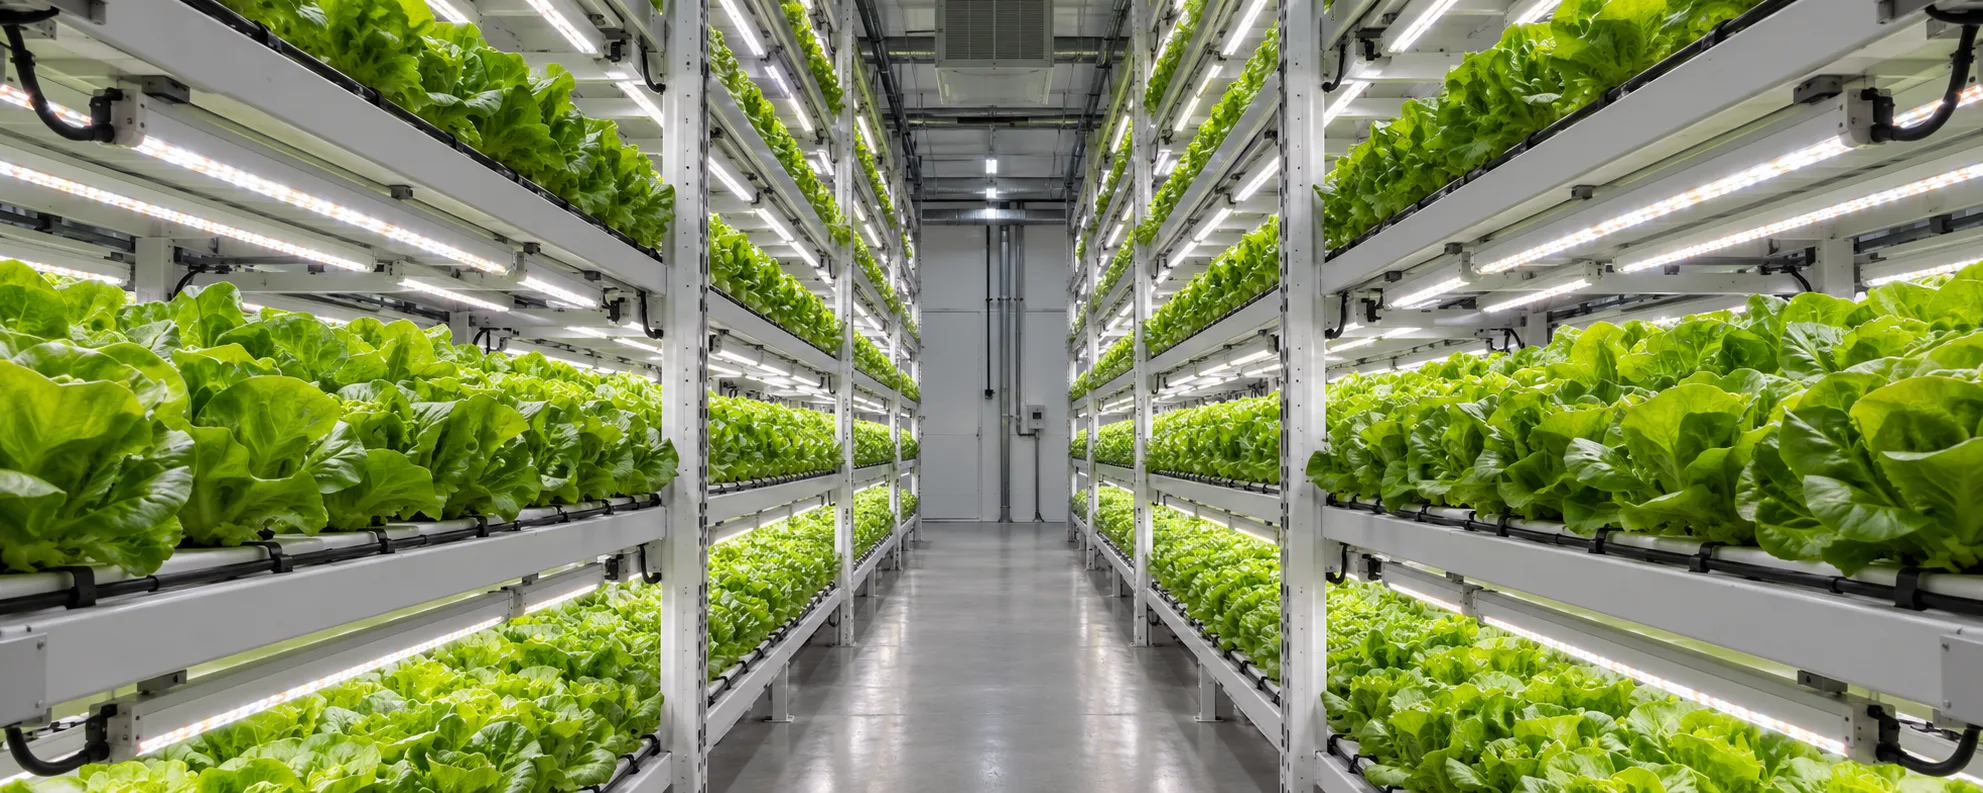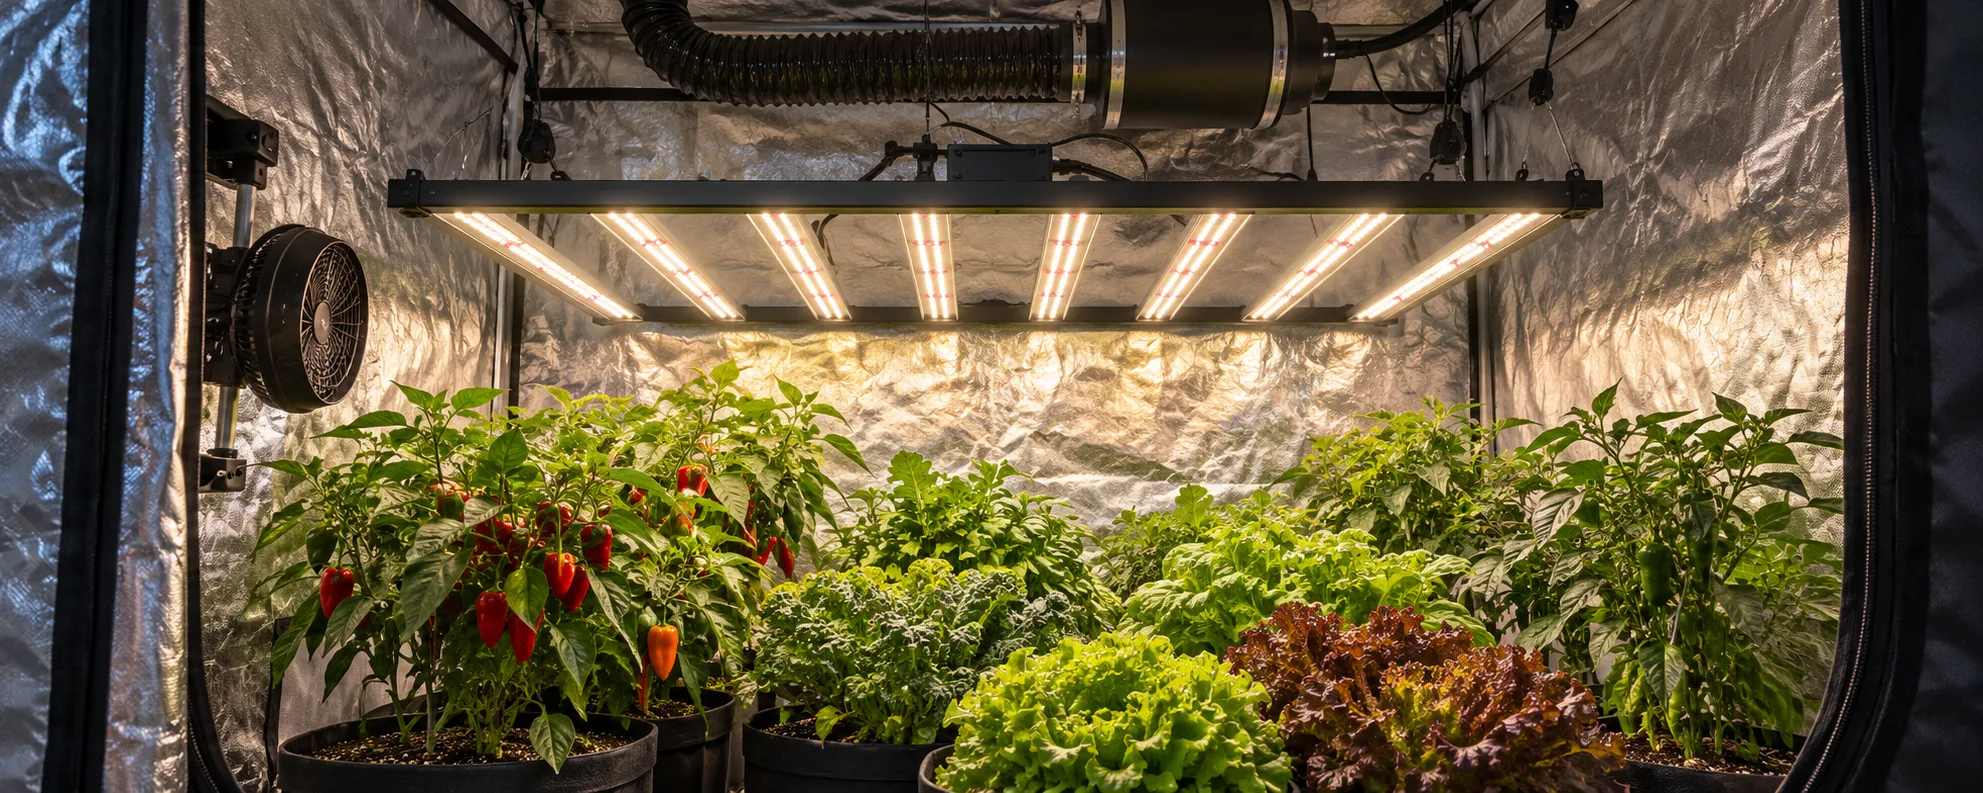
A commercial indoor farm LED layout starts from the target PPFD at the canopy and the room footprint, then sets fixture spacing and mounting height so that light overlaps into a uniform blanket instead of bright spots and shadows. The fastest sanity check is a fixture-count estimate: multiply target PPFD by canopy area, then divide by fixture output and a uniformity factor. Treat that number as an estimate — a real layout uses a photometric model of your exact room. This article walks through spacing, height, overlap and a worked example you can adapt. For the underlying measurement terms see our PPFD vs PPF guide and the indoor growing industry page.
Start from the canopy, not the ceiling
Before drawing any layout, fix the light your crop needs at the canopy. Leafy greens and microgreens commonly run 200-350 µmol/m²/s, while flowering and fruiting crops sit higher at roughly 600-900 µmol/m²/s. These are planning ranges drawn from controlled-environment horticulture practice, not a guarantee for your specific genetics or environment. Work backwards from that target, your bench or floor area, and your mounting height to the number and type of fixtures required.
- Define target PPFD at the canopy from the crop stage, not from a watts-per-metre rule.
- Measure the true canopy area (benches, racks or floor) — not the room area.
- Decide mounting height from your ceiling and the fixture beam spread.
- Estimate fixture count, then validate with a layout simulation or a test grid.
- Confirm cooling, wiring and control channels before ordering.
Mounting height sets your coverage
Raising a fixture widens its footprint but lowers PPFD at the canopy roughly with the inverse square of distance. For any given fixture you are balancing coverage against intensity. The table below is illustrative only — it assumes a generic mid-power bar and a stated beam, and is meant to show the relationship, not to quote a real product. Always request a coverage map from the manufacturer for the actual fixture and your ceiling height.
| Mounting height | Approx. footprint | Relative canopy PPFD | Typical use |
|---|---|---|---|
| 0.30 m | 0.6 x 0.6 m | High (near field) | Propagation shelves, clones |
| 0.60 m | 1.0 x 1.0 m | Medium | Rack tier, vertical farm layer |
| 1.20 m | 1.6 x 1.6 m | Lower | Single-tier bench, low ceiling |
| 2.00 m | 2.4 x 2.4 m | Lowest | High-bay indoor room |
Uniformity comes from overlap
Average PPFD means little if half the bench is under-lit. The metric that matters is the coefficient of variation (CV) — the standard deviation divided by the mean, expressed as a percentage. Lower is better; most commercial operations target a CV under 15 percent across the usable canopy. You reach good uniformity by overlapping fixtures so each point on the canopy is lit by more than one source, rather than placing them edge-to-edge and accepting scalloped light.
Why average PPFD hides the problem
An average PPFD of 500 with a CV of 30 percent means parts of your bench sit near 350 while others sit near 650. Crop maturity staggers, labour scheduling breaks, and grade-out drops. Plan for overlap and a documented CV, not just a headline average.
Worked fixture-count estimate
Use this estimate to size an order before you run a layout model. It answers "roughly how many fixtures" — it is not a substitute for a photometric plan.
| Step | Calculation | Result |
|---|---|---|
| Total photon demand | 400 × 32 | 12,800 µmol/s |
| Divide by fixture output | 12,800 ÷ 1,000 | 12.8 fixtures |
| Apply uniformity factor | 12.8 ÷ 0.85 | 15.1 fixtures |
| Round up to grid | Ceiling of 15.1 | 16 fixtures |
This is an initial estimate. It is not a lighting layout and not a verified PPFD — the same distinction we draw on the indoor growing industry page. A layout model then places those ~16 fixtures on a grid and reports the actual CV across your benches.
Where to go next
Once the count is estimated, match fixtures to your ceiling and control needs in our quantum board grow lights and foldable LED bar grow lights ranges, and read the commercial indoor farm buying guide for supplier evaluation.
Worked example: layout for a 12 m x 28 m production room
The following numbers are an illustrative estimate, not a measured result. Suppose you operate a 12 m x 28 m room (336 m2 of canopy) growing leafy greens on benches at a target PPFD of 250 umol/m2/s over an 18 hour photoperiod. You are comparing fixtures rated at 1,600 PPF with a manufacturer-stated efficacy of 2.7 umol/J.
- Step 1 - required average PPFD: 250 umol/m2/s confirmed from your crop band; verify with a quantum sensor grid before committing to a layout.
- Step 2 - daily light integral: DLI = 250 x 18 x 0.0036 = 16.2 mol/m2/day, a reasonable band for baby leaf and basil production.
- Step 3 - assume a uniformity factor of 1.15 to cover edge losses and mounting variation; effective required PPF = 250 x 336 x 1.15 = 96,600 umol/s.
- Step 4 - fixture count = 96,600 / 1,600 = 60.4, rounded to 64 fixtures so the grid divides cleanly into 8 rows of 8 across the 12 m width.
- Step 5 - electrical load: 64 x (1,600 / 2.7) = 64 x 593 W = roughly 37.9 kW of fixture draw before driver losses and HVAC; confirm your panel capacity.
- Step 6 - mount at 0.30-0.45 m above the canopy for bar-style optics and re-check edge PPFD after the first mapping run.
Every number above moves if one input changes. A lower target PPFD, a tighter uniformity factor from better optics, or fixtures with higher PPF all reduce the count. This is exactly why the layout should be calculated, not copied from another room.
Uniformity: the metric most layouts get wrong
Why averages hide problems
A room can average exactly 250 umol/m2/s and still grow unevenly. If one bench sits at 320 and the neighbouring aisle shading sits at 180, plants in the low zone stretch and delay while plants in the high zone may tipburn. Uniformity is expressed as the ratio of minimum to average PPFD (or minimum to maximum), and commercial layouts typically aim for a min-to-avg ratio of 0.85 or better across the productive canopy. Aisles, walls and walkways can be darker; the canopy cannot.
How to map a room properly
Map after installation, not only on paper. Set the photoperiod to a dimmed or short test window, then sample PPFD at canopy height on a 1.0-1.5 m grid including the edges of every bench. Record each point, compute the average and the minimum, and adjust: raising fixtures slightly spreads overlap and softens hotspots, while adding a border row of fixtures lifts chronic edge deficits. Re-map after any fixture change, bench move or canopy height shift, because the map is only valid for the geometry it was measured in.
Questions to ask before you buy
Fixture datasheets are written in the best-case language of the vendor. These questions keep a layout quote comparable across suppliers:
- Is the PPF figure a measured value from an independent lab, and at what drive current and case temperature?
- What is the stated PPE, and does it hold at the drive level the layout actually uses?
- Can the supplier provide a photometric file (IES/LDT) so the layout can be simulated in lighting software before purchase?
- What uniformity does the supplier commit to at the proposed mounting height, and is it stated as min-to-avg or min-to-max?
- What is the warranty terms, driver brand and expected L90 lifetime at your ambient temperature?
- Are fixtures dimmable to 10 percent or lower, and is a 0-10V, PWM or digital protocol used?
- What is the lead time, spare parts policy and price for replacement drivers after warranty?
A supplier who answers these in writing is easier to hold to specification than one who sells on headline efficacy alone. When comparing quotes, normalize everything to cost per delivered PPF at canopy level, including mounting hardware and controls, rather than price per fixture.
References you can verify
- e-GRO - controlled environment lighting guidance and grower trials
- Michigan State University College of Agriculture and Natural Resources
- University of Florida IFAS - horticulture extension
- DesignLights Consortium - horticultural lighting technical requirements
Frequently asked questions
How close can LED bars be to the canopy?+
It depends on the fixture watt density and heatsink. On racks, 0.3-0.6 m is common for low-watt bars; higher-watt fixtures need more clearance. Always follow the manufacturer clearance and check leaf temperature, not just distance.
What uniformity should I target?+
A coefficient of variation under 15 percent across the usable canopy is a reasonable commercial target. Below 10 percent is excellent but costs more in overlap and fixture count.
Is the fixture-count formula accurate?+
It is an estimate for ordering and budgeting. It assumes a single uniformity factor and ignores room reflection and fixture spacing geometry. A photometric layout is the real validation step.
Do I need overlapping fixtures on a single tier?+
Usually yes. Overlap is what flattens the scalloped pattern between fixtures and lowers CV. Edge-to-edge placement typically produces bright centres and dim seams.
Should spacing differ for leafy vs flowering crops?+
Yes. Flowering crops need higher PPFD, so at the same fixture you either lower the height, add fixtures, or accept a smaller footprint per fixture — which tightens spacing.
How do I verify the layout after install?+
Measure PPFD on a grid (e.g. every 0.5-1 m) at canopy height with a calibrated quantum sensor, then compute the average and CV. Compare against the target and the estimate.
Need a layout for your room?
Send us your canopy area, ceiling height, crop and target PPFD. We return a fixture proposal and a layout suggestion.
Get a Grow Light Solution