LUMAGROW

Industry Application

LED Grow Lighting for Vertical Farming

Vertical farming lighting must balance crop light requirements, shelf spacing, light uniformity, fixture efficiency and heat management across every growing level. Because each tier is a separate lighting zone stacked in one conditioned room, the design is driven by layer height and photons per kilogram of produce — not by a single room-level PPFD target.

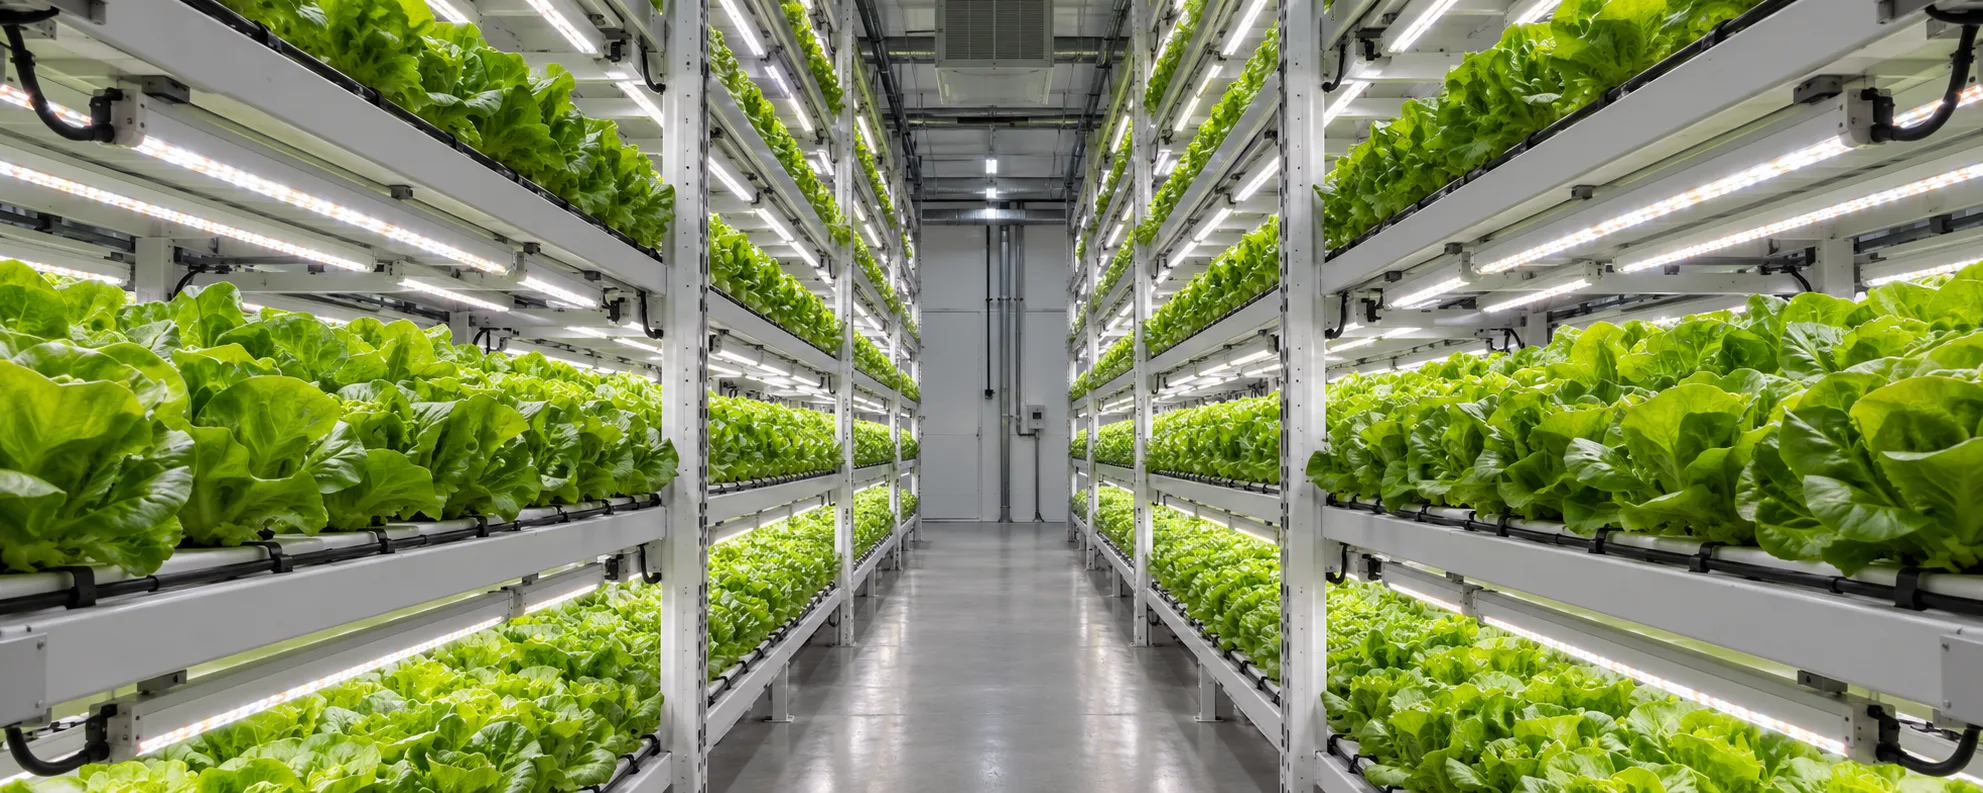
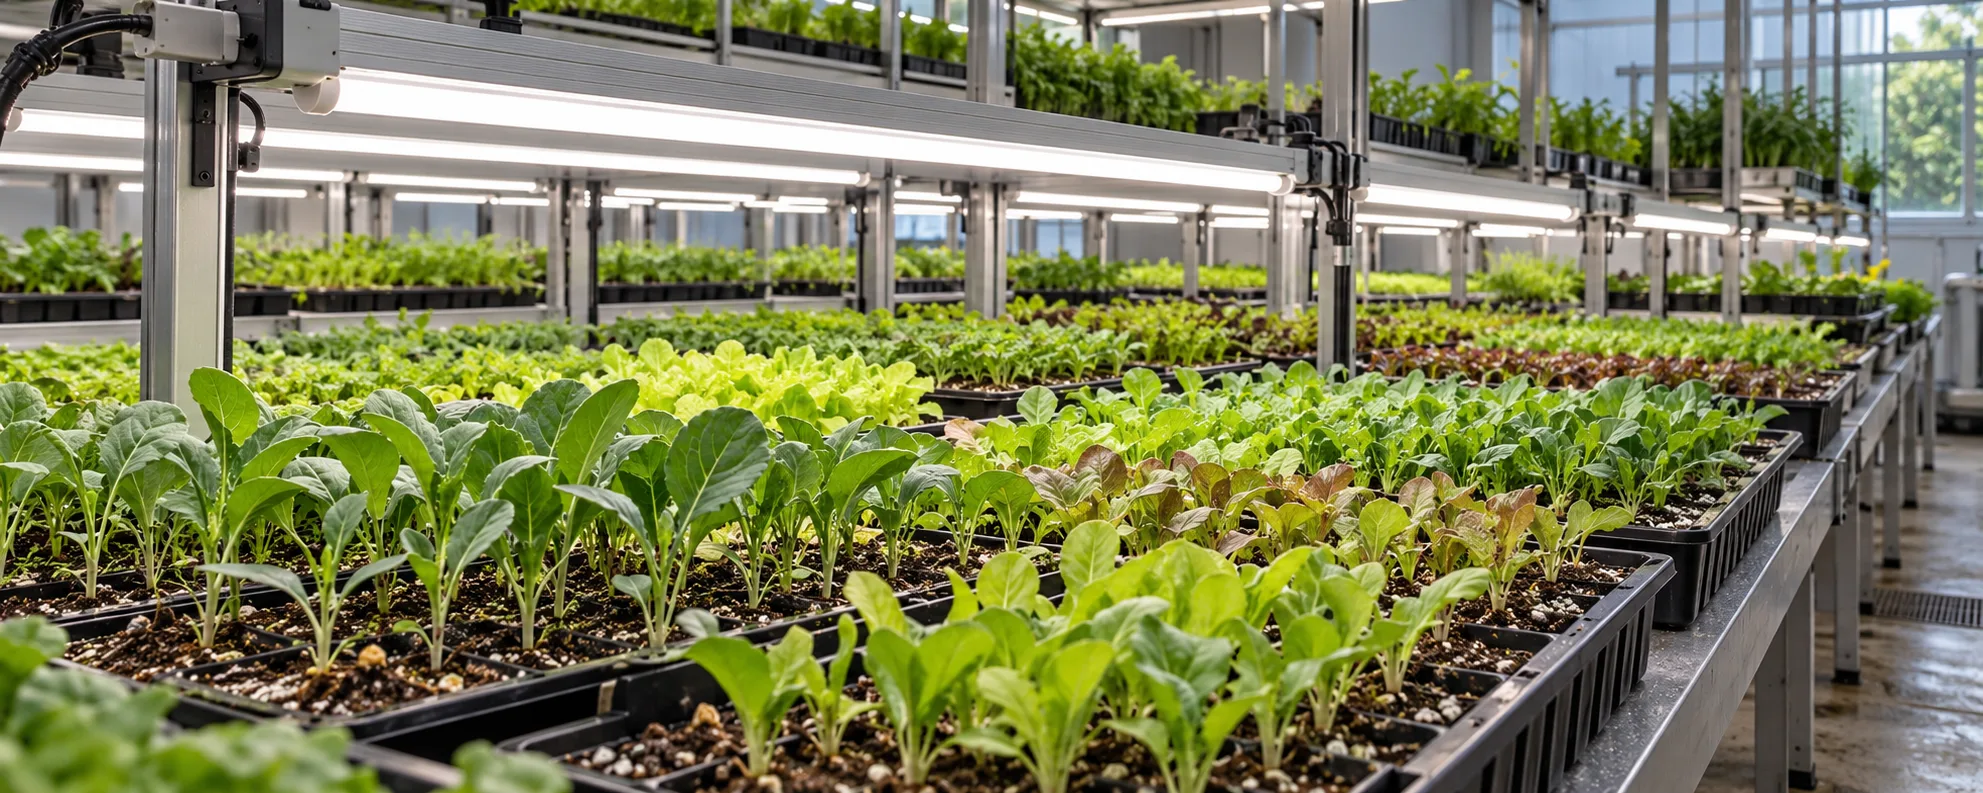
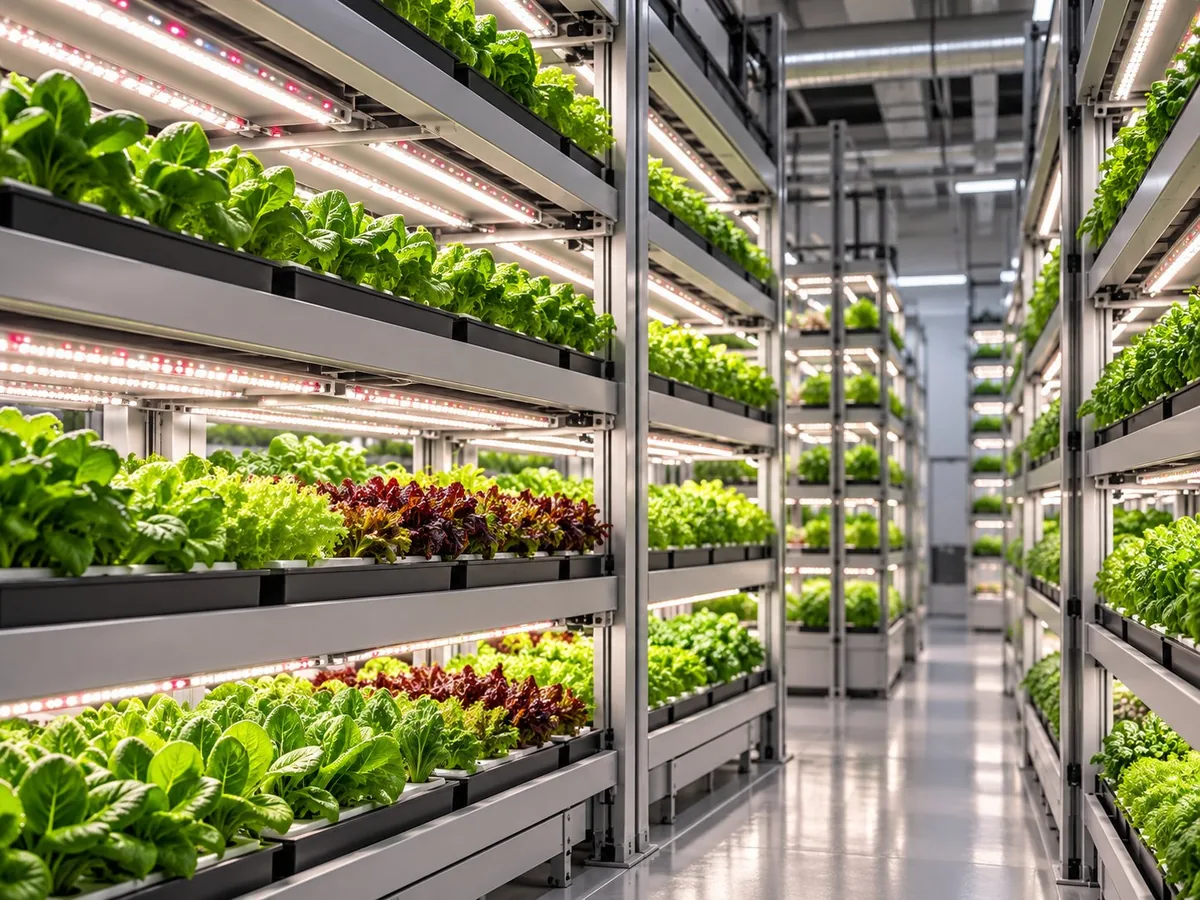
Illustrative view of multi-tier vertical farming racks with leafy greens under LED grow light bars

Illustrative image of a typical vertical farming environment — not a customer installation photograph.

Technical focus on this page

Multi-layer geometry, layer height, uniformity and energy per kilogram

How this application works

What drives lighting decisions in vertical farming

In a vertical farm the lighting system is no longer one installation; it is repeated dozens of times, once per tier, and every design decision multiplies. A fixture that is 8 mm too deep can cost a layer in a rack. A layout that is 10% less uniform produces a harvest that varies by tier, which complicates grading and packing more than a lower average yield would.

The tight constraint is vertical space. Typical leaf-greens racks run with 300–450 mm between the tray surface and the underside of the fixture, which limits heat-sink volume, driver placement and beam clearance. Slim linear bars with remote or top-entry drivers exist precisely because the geometry, not the wattage, decides what fits.

The second constraint is heat. Nearly all input power is rejected inside the growing envelope, and in a sealed multi-tier room that heat has to be removed by the HVAC system before it reaches the crop. Energy cost per kilogram is therefore a function of fixture efficacy, layer geometry, airflow and cooling — all four together. A published comparison of plant factories and greenhouses illustrates the scale: producing one kilogram of lettuce dry weight took around 247 kWh of electricity in a plant factory, against 70 to 211 kWh in greenhouses depending on location and whether supplemental lighting was used (Graamans et al. 2018).

Application challenges

What makes vertical farming lighting difficult

These are the constraints that decide whether a lighting plan survives contact with an operating facility.

01

Layer height limits fixture design

With 300–450 mm of clearance, a fixture with a deep heat sink or a bulky driver reduces the usable growing height or forces a wider tier pitch. Every millimetre of fixture depth is paid for across the whole rack footprint.

02

Uniformity multiplies by the number of tiers

Uneven light within one tier produces uneven plants; repeated across twenty tiers it produces systematic differences by shelf position, which complicates harvest scheduling and packing specification.

03

Heat removal is the hidden cost

Lighting heat must be removed by refrigeration in most sealed vertical farms, and cooling energy can be a substantial share of the total. Lower fixture wattage for the same PPF reduces both lighting energy and cooling energy.

04

Wiring and control density

Hundreds of small fixtures mean hundreds of connections. Daisy-chain ports, per-tier circuits and a single control protocol per zone reduce installation labour and maintenance visits; poorly planned wiring becomes the limiting factor in scaling a design.

05

Access and maintenance in a rack

Fixtures must be cleanable and serviceable without dismantling a tier. Tool-free mounting, accessible drivers and consistent bar lengths matter more here than in any other application.

Lighting requirements

How to specify lighting for vertical farming

Each metric below has to be set from the crop, structure and operating practice — not from a generic watts-per-square-metre rule.

ParameterPlanning targetWhy it matters
PPFD at tray levelLeafy greens commonly 150–300 µmol/m²/s depending on cultivar and cycleTray-level PPFD, measured at the crop surface, is the only intensity that matters in a rack.
DLIAbout 12–17 mol/m²/day for lettuce and many leafy greens; higher for herbsShort cycles and long photoperiods can reach the same DLI at lower intensity, which reduces heat near the canopy.
Uniformity within a tierMinimum-to-average of about 0.85 is a reasonable design aim for rack lightingTray edges and rack ends are the first places to fall short; a single low corner changes the whole tier’s harvest date.
Fixture depth and beamSlim linear profile with a beam that covers the tier width at the installed heightLayer height is fixed by the rack; the fixture must fit inside it and still light the full tray width.
EfficacyCompare µmol/J within the same power class; higher efficacy cuts both lighting and cooling energyIn vertical farming the lighting system runs long hours every day of the year, so efficacy compounds. It is also finite: published analysis puts the practical ceiling for LED fixtures at about 3.4 µmol/J for white-plus-red and 4.1 µmol/J for blue-plus-red (Kusuma et al. 2020).
Heat rejected to the roomAccount for essentially all input wattage as internal loadCooling capacity, not fixture count, often limits how many tiers can be installed in a room.
Control granularityPer-tier or per-bank dimming and schedulingDifferent crops and transplant schedules share the same room; per-tier control preserves recipe flexibility.

Reference data

Comparison tables for planning

Planning references compiled from horticultural lighting literature and standards. They are starting points for your own trials, not guarantees of performance.

Reference crop targets for multi-tier leafy production
CropPPFD (µmol/m²/s)PhotoperiodDLI (mol/m²/day)Rack note
Lettuce (butterhead, romaine)150 – 25016 – 18 h10 – 16Tipburn risk rises with intensity and low airflow; keep uniformity tight
Baby leaf / rocket180 – 30016 – 18 h12 – 18Short cycles amplify any tier-to-tier variation
Basil200 – 35014 – 16 h12 – 20Responds strongly to DLI; leaf colour and aroma affected by spectrum
Microgreens100 – 20012 – 16 h6 – 11Tray density and airflow usually limit before light does
Kale / chard transplants200 – 30016 h11 – 17Stockier plants at higher DLI; watch leaf temperature near bars
Strawberry (rack)250 – 40014 – 16 h13 – 23Higher cooling load; verify cultivar response before committing

Planning references compiled from controlled-environment horticulture literature. Recipes must be validated on your own cultivar, substrate and airflow — vertical farms differ enough that published ranges are starting points only.

Layer geometry and what it forces in the lighting design
Layer clearanceFixture consequencePPFD consequencePractical check
300 – 350 mmSlim bar only; remote or top-entry driverVery close mounting; risk of hot spots and leaf scorchMeasure PPFD and leaf temperature at tray level, not at 300 mm
350 – 450 mmStandard slim bar with shallow heat sinkGood coverage with wide beam; watch bar-to-bar bandingCheck a grid across the tier width and at the tray edge
450 – 600 mmBar or compact board possibleHigher intensity per fixture; fewer bars per tierConfirm beam overlap before reducing bar count
600 mm+Board or bar; more driver placement freedomHigher mounting gives better uniformity but needs more PPFRecalculate PPF per tier rather than reusing a lower-tier layout

Geometry is usually fixed by the rack and the building, not by the lighting. The design must work within it, so these constraints should be settled before fixture selection.

Lighting system design

How to plan the system, step by step

The order matters: geometry and targets first, fixture count second, verification and control last.

  1. 1

    Fix the rack geometry first

    Tier pitch, tray width, aisle access and the number of layers determine almost everything else. Settle these before comparing fixtures, because a fixture that does not fit the clearance cannot be rescued by a better spectrum.

  2. 2

    Set the crop recipe per tier

    Decide PPFD, photoperiod and DLI for the crop on each tier. If tiers will carry different crops, plan separate control zones; otherwise the whole rack runs at the most demanding recipe.

  3. 3

    Calculate bars per tier from PPF, not from watts

    Multiply tray-level PPFD by tray area, apply a utilisation factor for edge and end losses, and divide by the PPF of one bar. Round to whole bars so the layout stays symmetrical across the tray width.

  4. 4

    Verify uniformity across the tray width

    Bar spacing and mounting height together set the banding pattern. Ask for a PPFD grid across a full tier — centre, mid and edge — and check the minimum, because the tray edge is where grading problems appear.

  5. 5

    Balance power density against cooling capacity

    Add the lighting wattage per tier to the room heat balance and confirm the HVAC can hold the target VPD. In sealed rooms the cooling limit is often reached before the electrical limit.

  6. 6

    Plan wiring, control and service access

    Daisy-chain ports, per-tier circuits and one control protocol reduce installation and maintenance cost. Confirm that a technician can reach and clean every fixture without removing a tray.

Worked example

Lighting a six-tier leafy greens rack

Illustrative example — assumptions stated below, not client data

Assumptions

  • Tray area per tier: 20 m² usable growing area
  • Number of tiers: 6 → 120 m² total canopy
  • Target tray-level PPFD: 250 µmol/m²/s
  • Photoperiod: 16 h
  • Bar basis: LUMAGROW 100 W rack bar — 250 µmol/s PPF at 100 W (2.5 µmol/J, product record)
  • Utilisation factor: 0.85
StepCalculationResult
DLI check250 × 16 × 0.003614.4 mol/m²/day — within the lettuce planning range
Total PPF at canopy level250 µmol/m²/s × 120 m²30,000 µmol/s
Installed PPF including losses30,000 ÷ 0.8535,294 µmol/s (reported as ≈ 35,300)
Bars required (photon budget)35,294 ÷ 250 µmol/s per bar141.2 → round up to 142 bars
Bars after tier symmetry142 ÷ 6 tiers = 23.7 → 24 bars per tier24 × 6 = 144 bars installed (regular structure beats a 142-bar odd layout)
Delivered PPFD check144 × 250 × 0.85 ÷ 120 m²≈ 255 µmol/m²/s — target met with a small margin
Installed load144 × 100 W14.4 kW for the rack
Daily lighting energy14.4 kW × 16 h230.4 kWh/day, all of which becomes internal heat load
Energy intensity indicator230.4 kWh ÷ expected daily harvest (kg)kWh per kg — the number to optimise when comparing fixture options

Bars per tier come from canopy PPFD, tray area and bar PPF, then round up twice: once for the photon budget (142) and once for tier symmetry (144). Every input above is an assumption you should replace with your own rack dimensions and measured PPFD; the arithmetic is the method, not a quotation.

Three different kinds of number

What this calculation is — and what it is not

The worked example above is an initial estimate. It is not a lighting layout, and it is not a verified PPFD. Keeping the three apart is what stops a photon budget from being quoted as delivered performance.

STAGE 1

Initial estimate

Tray-level PPFD × tray area ÷ utilisation allowance ÷ bar PPF, expressed as bars per tier and kilowatts for the rack.

Arithmetic only. It tells you what the rack will draw and roughly how many bars to quote for — nothing about the pattern of light on the tray.

STAGE 2

Lighting layout design

Bar spacing across the tier width, mounting height inside the available clearance, beam overlap, and the edge and end rows.

A per-tier PPFD grid at tray level, with the minimum value at the tray edge reported alongside the average — plus a leaf-temperature check at the closest clearance.

STAGE 3

Verified PPFD performance

Measured PPFD across a full tier, top tier and bottom tier, at the documented clearance and dim level.

Measurement data only. Tiers are not interchangeable: the top tier and the bottom tier must be measured separately, because airflow and temperature differ between them.

Fixture selection

Which grow light types fit this application

Selected from the six fixture categories we manufacture; the right mix depends on ceiling height, canopy structure and control requirements.

Propagation and rack bars

Primary lighting for every tier

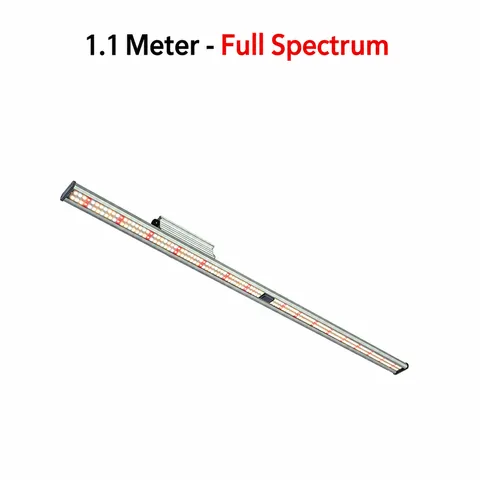
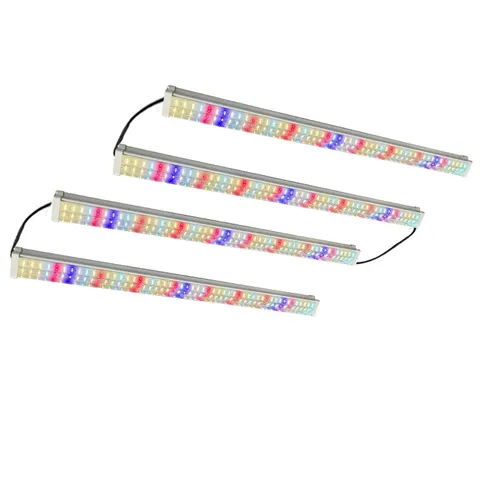
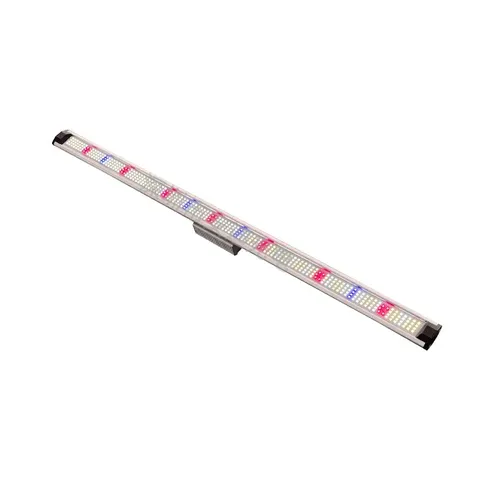
Slim linear profiles fit 300–450 mm clearances, spread light across the tray width and can be daisy-chained, which keeps wiring density manageable.

Low-power bars for microgreen and propagation tiers

Gentle, uniform light close to the tray

Short-cycle crops need lower intensity and better uniformity than high-output fixtures provide; lower wattage also reduces heat next to the canopy.

Compact board fixtures

Higher tiers, mother stock and taller crops

Where clearance allows, a board concentrates more PPF in a smaller footprint and reduces the number of connection points per tier.

OEM & ODM

Project support for brands and importers

We build fixtures to a specification, document what was built, and support the certification and packaging work that a private-label programme needs.

  • Bar length and mounting geometry adapted to your rack pitch and tray width
  • Per-tier or per-bank control options, including daisy-chain and timer integration
  • Spectrum recipes for greens, herbs and berry crops, supplied as documented recipes
  • Connector and cable specification matched to your rack wiring plan
  • Pilot bars for a single tier before a full-rack order

Common mistakes

Planning errors that are expensive to fix later

Each of these shows up after installation, when the layout is already fixed and the circuits are already run.

MistakeWhat to do instead
Treating a vertical farm as one big roomDesign per tier: each layer has its own height, uniformity pattern, heat load and control zone. A room-level average hides exactly the variation that ruins a harvest.
Choosing fixtures before fixing rack geometrySettle tier pitch, tray width and clearance first; then select a fixture depth and beam that fit inside those constraints.
Optimising peak PPFD instead of uniformityA tier with a bright centre and dim edges grades unevenly. Check minimum-to-average across the tray width, including the edge row.
Ignoring cooling energy in the business caseLighting wattage becomes internal heat that refrigeration must remove. Compare fixtures on total energy — lighting plus cooling — not lighting alone.
Under-planning wiring and accessHundreds of fixtures need planned circuits, connectors and service access. Retrofitting cable routing into an operating rack is expensive and disruptive.

Technical references

Every technical figure on this page is traceable to one of the sources below. Each entry gives the publication, its author or issuing body and year, a resolvable link, and the specific claim on this page that it supports — an institution name on its own is not evidence, and no manufacturer marketing material is used here as independent research. All links were checked and resolved on 19 October 2026.

  1. 1
    Plant factories versus greenhouses: comparison of resource use efficiency

    Graamans L., Baeza E., van den Dobbelsteen A., Tsafaras I. & Stanghellini C., Agricultural Systems 160: 31–43 (2018)

    Supports on this page: The energy-intensity comparison used in the overview: about 247 kWh of electricity per kilogram of lettuce dry weight in a plant factory, against 70–211 kWh in greenhouses by location and supplemental-lighting regime.

  2. 2
    From physics to fixtures to food: current and potential LED efficacy

    Kusuma P., Pattison P.M. & Bugbee B., Horticulture Research 7:56 (2020)

    Supports on this page: The ceiling on fixture efficacy (3.4 µmol/J white + red, 4.1 µmol/J blue + red, roughly 10% lower with optical protection), which is what makes an efficacy-based comparison between rack fixtures meaningful rather than open-ended.

  3. 3
    Daily Light Integral: A Research Review and High-resolution Maps of the United States

    Faust J.E. & Logan J., HortScience 53(9): 1250–1257 (2018)

    Supports on this page: The DLI figures in the crop table and the note that a rack recipe is a DLI target delivered through a PPFD and photoperiod pair, not a PPFD target on its own.

  4. 4
    Horticultural Lighting Technical Requirements, Hort V4.0

    DesignLights Consortium, technical requirements effective 18 April 2025

    Supports on this page: Comparing rack fixtures at a defined class and test configuration, including efficacy and quality metrics, rather than on a headline wattage or a single-point PPFD reading.

  5. 5
    ANSI/ASABE S640 — Quantities and Units of Electromagnetic Radiation for Plants

    American Society of Agricultural and Biological Engineers, standard S640 JUL2017 (reaffirmed 2022)

    Supports on this page: The units the per-tier calculation depends on: PPF in µmol/s per bar, PPFD in µmol/m²/s at tray level, DLI in mol/m²/day and PPE in µmol/J.

Where a source could not be confirmed as publicly accessible, the claim it would have supported has been written as a lower-certainty statement rather than given a citation. Planning ranges remain starting points for your own trials — they are not guarantees of performance, and no figure on this page is a quotation.

Industry FAQ

Vertical Farming lighting questions

Specific follow-up questions about this application, answered directly and then explained.

How many grow light bars do I need per rack tier?

Divide the required PPF for that tier by the PPF of one bar. For 250 µmol/m²/s over a 20 m² tier with a 0.85 utilisation factor you need about 5,900 µmol/s, which is roughly 24 bars of 250 µmol/s. The bar count must then be arranged symmetrically across the tray width so the banding pattern stays even.

What layer spacing do vertical farm lights need?

Most leafy-green racks run 300–450 mm between the tray surface and the fixture. The lower end requires slim bars with remote or top-entry drivers and very careful heat checks; above 450 mm there is more freedom in fixture depth and beam choice, but the PPF per tier must be recalculated rather than reused.

Why does uniformity matter more than peak PPFD in a vertical farm?

Because every tier repeats the same pattern. A bright centre and dim edges produce plants of different size and maturity on the same tray, which complicates harvesting, grading and packing. A slightly lower but even PPFD usually produces a more consistent crop and a simpler operation.

How do I reduce energy cost per kilogram?

Work on four levers together: fixture efficacy in µmol/J, layer geometry that puts light where the canopy actually is, uniformity that avoids over-lighting to compensate for dim corners, and cooling load reduced by lower internal heat. Comparing fixtures on lighting energy alone understates the difference between designs.

Can I use the same fixture on every tier?

Often yes, but not always at the same dim level. Propagation and microgreen tiers usually want lower intensity than finishing tiers, so per-tier dimming lets one bar type serve the whole rack. Without per-tier control, the rack runs at the most demanding recipe on every layer.

How does lighting affect HVAC load in a vertical farm?

Nearly all electrical input is rejected as heat inside the sealed envelope, so lighting wattage is a direct internal load. Reducing watts per µmol lowers both lighting energy and the refrigeration energy needed to remove that heat — which is why efficacy matters more here than in any other application.

Should I replace fluorescent tubes in existing racks with LED bars?

Usually yes, because LED bars deliver more photons per watt and can be shaped to the tray. But the retrofit must respect the existing tier clearance, the wiring and the control architecture; a direct tube-for-tube swap by length often leaves the PPFD distribution worse than the original.

Planning a vertical farming lighting project?

Send the growing area, crop and stage, target PPFD or DLI, ceiling or layer height and your market requirements. We will come back with a fixture proposal, a layout suggestion and the documentation you need to evaluate it.