
Comparability across chambers and runs
Results are only comparable if the lighting conditions are. Chambers with different fixtures, ages or calibration histories introduce differences that can be mistaken for treatment effects.
Industry Application
Horticultural research lighting is specified by reproducibility rather than by wattage: the fixture must hold a defined spectrum and PPFD across every treatment position, document what it delivered, and allow the same conditions to be recreated in another chamber or another year. That is why channel control, uniformity across treatment groups and a measurement protocol matter more than peak output.
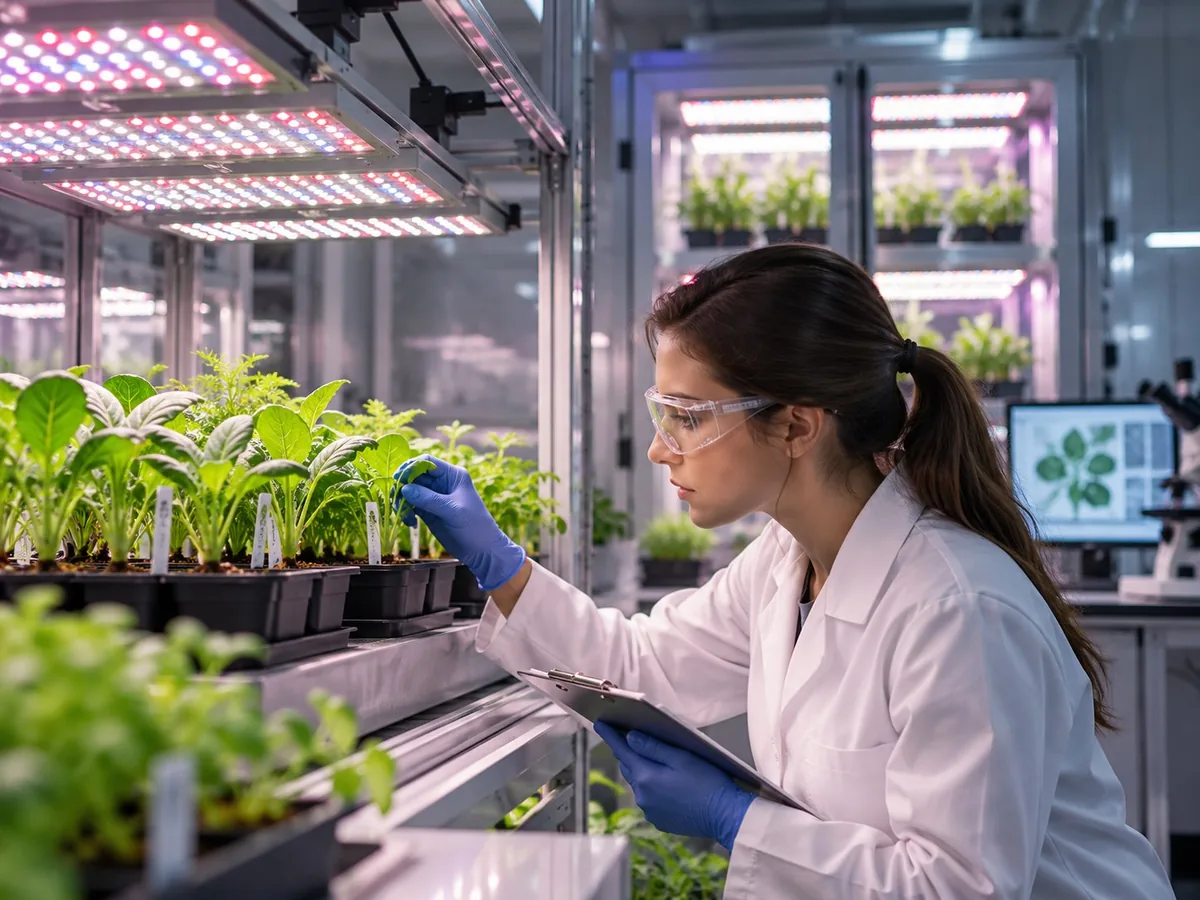
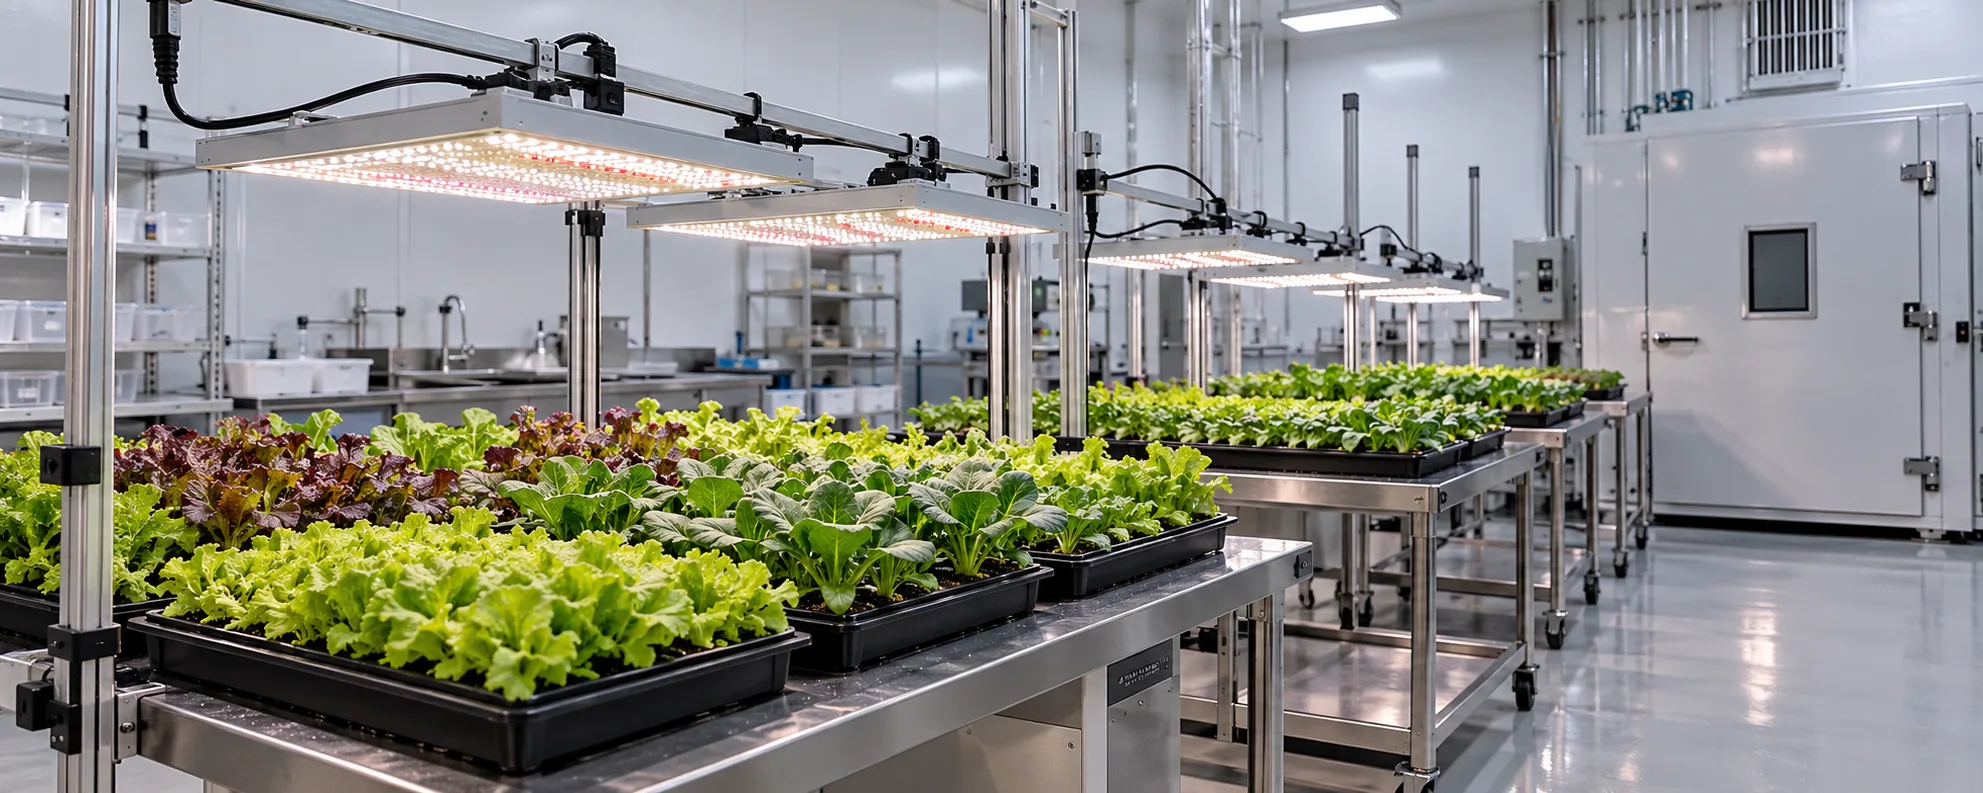
Illustrative image of a typical horticultural research environment — not a customer installation photograph.
Technical focus on this page
Reproducible spectra, measurement protocol and treatment comparability
How this application works
An experiment is only as good as its lighting record. If two treatment groups receive different PPFD because one sits near a wall, or if the spectrum drifts between runs because channels were set by eye, the results confound lighting with position and time. Lighting specification for research therefore starts from the experimental design — how many treatment groups, how many replicates, where they sit — and then asks what fixture arrangement can hold those conditions constant.
Multi-channel fixtures are used in research because they let a protocol define spectral composition as a set of channel percentages rather than as a fixed product. That makes it possible to run a blue:red ratio series, add a far-red treatment, or repeat a published spectrum, without buying a new fixture for each treatment. A published in-vitro LED-versus-fluorescent comparison illustrates the level of detail a reproducible protocol needs: 660 nm red and 460 nm blue at a 2:1 ratio, a 16 h photoperiod, and a stated growing medium — because the same treatment produced different results once activated charcoal was added (Nguyen, Vu, Huo & Pearson, UF/IFAS EP583).
Measurement closes the loop. A quantum sensor reading at canopy height, taken on a grid and repeated over time, is what turns a fixture setting into a documented experimental condition. Without it, the lighting is an assumption rather than a variable under control. The waveband you report also matters: the conventional 400–700 nm definition of photosynthetic photons excludes far-red, yet long-term canopy gas-exchange work found that substituting far-red for 400–700 nm photons gave an equal canopy quantum yield for CO₂ fixation, which is why a method section should state the waveband it actually delivered (Zhen & Bugbee 2020).
Application challenges
These are the constraints that decide whether a lighting plan survives contact with an operating facility.
Results are only comparable if the lighting conditions are. Chambers with different fixtures, ages or calibration histories introduce differences that can be mistaken for treatment effects.
Channel percentages set by eye, or drivers that respond non-linearly at low dim levels, shift the delivered spectrum. A protocol needs a measurement step, not just a setting.
Edge positions receive less light and different spectra at the boundary of overlapping fixtures. Randomising trays helps, but a layout with better inherent uniformity reduces the size of the correction needed.
Light intensity changes leaf temperature, transpiration and VPD. If those are not held or measured, the experiment cannot separate a light effect from a microclimate effect.
Peer review and internal audit both ask what light the plants received. A settings list is weaker evidence than a measured PPFD grid with a dated calibration record.
Lighting requirements
Each metric below has to be set from the crop, structure and operating practice — not from a generic watts-per-square-metre rule.
| Parameter | Planning target | Why it matters |
|---|---|---|
| Spectral definition | Channel percentages or absolute spectral irradiance, stated per treatment | A reproducible spectrum is the independent variable in most lighting experiments, and published protocols show how precisely it has to be stated: wavelength peaks, the ratio between them and the photoperiod, not a product name (Nguyen et al., UF/IFAS EP583). |
| Channel control | Independent dimming of at least 3 channels for multi-factor designs | Independent channels allow ratio series and far-red or UV additions without new hardware. |
| PPFD uniformity across treatments | Minimum-to-average of about 0.9 within a treatment block is a reasonable aim | Position differences within a treatment become noise that can mask real effects. |
| Photoperiod precision | Timer accuracy to the minute, with documented dawn/dusk transitions if used | Photoperiod is often a treatment variable; imprecise switching undermines it. |
| Measurement protocol | Calibrated quantum sensor, grid at canopy height, repeated at defined intervals | Measured values are the record that makes the experiment auditable. |
| DLI documentation | Report DLI alongside PPFD: DLI = PPFD × hours × 0.0036 | DLI allows comparison between experiments that used different photoperiods. |
| Ageing and output maintenance | Record fixture hours and re-measure output at defined intervals | Output declines over life; without re-measurement, later runs differ from earlier ones. |
Reference data
Planning references compiled from horticultural lighting literature and standards. They are starting points for your own trials, not guarantees of performance.
| Design type | Channels needed | Typical use | Documentation load |
|---|---|---|---|
| Single-spectrum intensity response | 1 | PPFD or DLI series under one spectrum | Low — one spectrum to verify per run |
| White plus red series | 2 | Red:far-red or red:blue ratio studies | Moderate — two channels to log per treatment |
| Multi-factor spectrum design | 3 or more | Independent white, red and blue/far-red treatments | High — channel matrix per treatment |
| UV or far-red addition study | 3 – 4 | Supplemental UV-A/UV-B or far-red effects | High — includes safety and shielding records |
Channel count follows from the design, not from a general preference for more control. Adding channels adds calibration work, so specify only what the protocol needs.
| Item | What to record | Why it matters |
|---|---|---|
| Sensor calibration | Date, reference, deviation | An uncalibrated sensor makes every PPFD value provisional |
| PPFD grid | Positions, heights, values, date | Documents uniformity and detects position effects |
| Spectrum verification | Channel settings plus measured spectrum | Detects drift between setpoint and delivered light |
| Photoperiod | Switch times, ramp profile | Photoperiod is often a treatment variable |
| DLI | Computed per treatment per day | Allows comparison across photoperiods and studies |
| Fixture hours | Cumulative operating hours at each measurement | Output declines with age; later runs differ |
A lighting record that satisfies peer review and internal audit. Adapt the intervals to the length of the trial. The quantities and units to report are defined in ANSI/ASABE S640, and the test-and-reporting method for horticultural lighting systems in ANSI/ASABE S642.1, both listed in the ASABE published-standards catalogue.
Lighting system design
The order matters: geometry and targets first, fixture count second, verification and control last.
Count treatments, replicates and positions before selecting fixtures. The layout must give every treatment block comparable light, which usually means a grid of identical fixtures rather than a few large ones.
Write each treatment as channel percentages or target spectral irradiance, not as a description. Record the fixture model, driver and firmware or control setting used to achieve it.
Keep treatment blocks away from chamber edges and doorways, space fixtures to overlap at canopy height, and verify with a PPFD grid. If uniformity cannot reach the target, randomise positions and document the residual variation.
Choose sensor, grid size, measurement height and interval, then apply them identically to every run. Changing the protocol mid-series breaks comparability more than a small systematic error would.
Measure leaf temperature, air temperature and humidity alongside PPFD, because changing intensity changes the microclimate. Without those records, a light effect and a temperature effect cannot be separated.
Store channel settings, measured PPFD grids, calibration dates and fixture hours with the experiment data. That record is what allows the run to be repeated or defended later.
Worked example
Illustrative example — assumptions stated below, not client data
| Step | Calculation | Result |
|---|---|---|
| DLI for the treatment | 300 × 18 × 0.0036 | 19.4 mol/m²/day |
| Uniformity from the grid | minimum reading ÷ mean reading | e.g. 270 ÷ 300 = 0.90 — report the minimum, not only the mean |
| Coefficient of variation | standard deviation ÷ mean | 15 ÷ 300 = 5% — a compact measure of grid variability |
| Spectral verification | measured spectrum at the same grid centre | Compare channel ratios with the setpoint; record any deviation |
| Record for the run | settings + grid + calibration date + fixture hours | A reproducible treatment definition for later comparison or repeat |
The deliverable of a research lighting setup is a documented condition, not a fixture. Report mean PPFD, minimum-to-average uniformity, DLI and the spectral verification together, and the run can be repeated and compared. Report the waveband too — a far-red-containing treatment described only as “PAR 400–700 nm” understates the photons the plants actually received.
Three different kinds of number
The worked example above is an initial estimate. It is not a lighting layout, and it is not a verified PPFD. Keeping the three apart is what stops a photon budget from being quoted as delivered performance.
The channel settings and nominal PPFD that the design intends to deliver to each treatment block, before the chamber is measured.
A setpoint, not a condition. It can be written in a protocol draft, and it must never appear in a results section as though it were the delivered treatment.
Fixture positions, overlap at canopy height, treatment-block boundaries and a predicted uniformity map for each block.
A design deliverable: block-level PPFD maps, the residual variation between blocks, and the randomised-order scheme that will be used if uniformity falls short.
Measured PPFD grids, measured spectra and measured DLI per treatment, with a dated sensor calibration and the fixture hours at the time of measurement.
Measurement data only. This is the record that goes into the method section and into the archive alongside the biological data.
Fixture selection
Selected from the six fixture categories we manufacture; the right mix depends on ceiling height, canopy structure and control requirements.
Primary lighting for treatment designs
Independent channel control turns spectrum into a variable rather than a fixed product attribute, which is what most lighting experiments require.
Adding a defined waveband to a base spectrum
A separate UV or far-red source can be added to an existing base spectrum without rebuilding the whole lighting system.
Base lighting across treatment blocks and chambers
A grid of identical, evenly spaced fixtures gives the positional consistency that replication depends on.
Real products
Specifications shown are the confirmed values from each product record. Where a parameter is not confirmed by the source material, it is not displayed here.
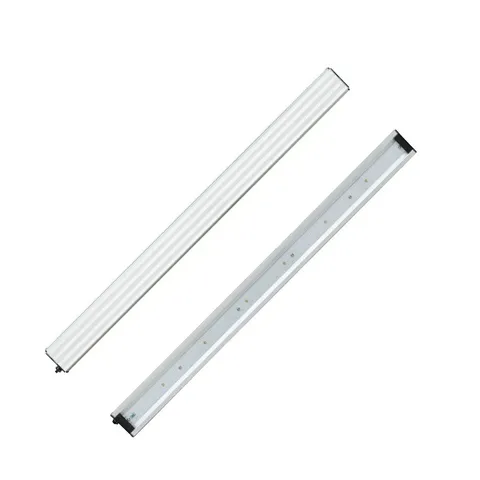
30W UV-A + UV-B bar, 71 diodes, 0.5 m, IP65, plug-in connection.
View product details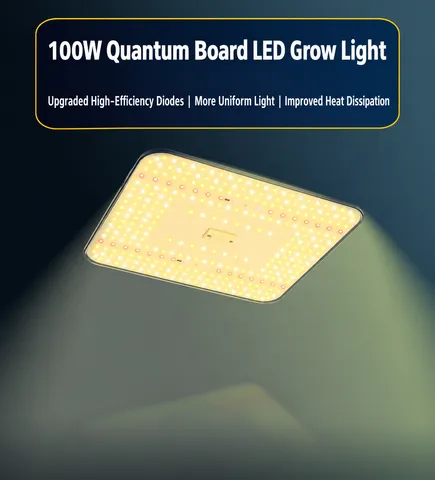
100W board with plastic housing, AC120–277V, IP65, 621 diodes, WiFi group control.
View product details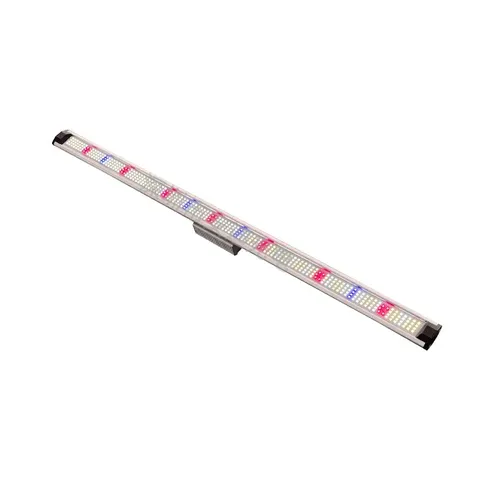
100W rack bar, 1045 mm, 14,946 lm, 281B diodes, IP54, knob dimming.
View product detailsOEM & ODM
We build fixtures to a specification, document what was built, and support the certification and packaging work that a private-label programme needs.
Common mistakes
Each of these shows up after installation, when the layout is already fixed and the circuits are already run.
| Mistake | What to do instead |
|---|---|
| Comparing fixtures by wattage | Compare PPF, PPE and delivered PPFD at canopy height. Wattage says nothing about the light a treatment block receives. |
| Setting channels by eye | Verify the delivered spectrum with a spectroradiometer and record the measured values. Channel percentages on a controller are a setting, not evidence. |
| Reporting a single PPFD reading | Report a grid with mean, minimum and uniformity, plus the measurement height. A single point cannot describe a treatment block. |
| Changing spectrum mid-experiment without recording it | Treat any lighting change as a protocol amendment: record the date, the setting and the reason, or the run becomes uninterpretable. |
| Ignoring UV safety and shielding | UV-containing configurations need appropriate shielding, signage and operating procedures; document them with the lighting record. |
Related technical guides
Published articles that explain the measurement and selection logic used on this page.
Technology
PPF is total photon output (µmol/s), PPFD is canopy intensity (µmol/m²/s), and PPE is efficacy (µmol/J). Learn the exact units, formulas and how to use each when specifying LED grow lights.
Read the guideTechnology
PPF and PPFD are the two most quoted numbers on a grow light spec sheet — and the two most commonly confused. Here is what each one measures and how to use them.
Read the guideTechnology
Full-spectrum fixtures are the default choice for most growers. Multi-channel systems cost more but add spectral control. Which one fits your operation?
Read the guideRelated articles
In-depth guides written for this application — planning, spectrum, DLI and layout.
Horticultural Research
How plant-science labs design LED light treatments: defining spectra precisely, isolating one variable, and reporting what was actually delivered for reproducible results.
Read ArticleHorticultural Research
How to measure PPFD and efficacy (PPE) correctly in research growth chambers: sensor choice, mapping a chamber, and turning measurements into comparable numbers.
Read ArticleHorticultural Research
Make lighting recipes reproducible across chambers and over time: document every parameter, control the environment, and version the recipe like code.
Read ArticleEvery technical figure on this page is traceable to one of the sources below. Each entry gives the publication, its author or issuing body and year, a resolvable link, and the specific claim on this page that it supports — an institution name on its own is not evidence, and no manufacturer marketing material is used here as independent research. All links were checked and resolved on 19 October 2026.
American Society of Agricultural and Biological Engineers, standard S640 JUL2017 (reaffirmed 2022)
Supports on this page: The quantities, units and spectral weighting a methods section has to report: PPF, PPFD, DLI, and the definition of the photosynthetic waveband.
American Society of Agricultural and Biological Engineers, listed in the ASABE published-standards catalogue
Supports on this page: The measurement and reporting method behind the documentation checklist — what a test report for a horticultural fixture should contain.
Nguyen C.D., Vu D., Huo H. & Pearson B., UF/IFAS Extension, ENH1319/EP583
Supports on this page: The example of a reproducible spectral protocol (660 nm red plus 460 nm blue at 2:1, 16 h photoperiod, stated medium) and the finding that the LED effect depended on the medium — evidence for stating spectrum and medium precisely rather than describing a treatment loosely.
Zhen S. & Bugbee B., Frontiers in Plant Science 11:581156 (2020)
Supports on this page: The argument for reporting the waveband actually delivered: far-red photons substituted for 400–700 nm photons gave equal canopy quantum yield, so a “PAR” figure alone can misdescribe a treatment.
Kusuma P., Pattison P.M. & Bugbee B., Horticulture Research 7:56 (2020)
Supports on this page: The note that spectral effects on photosynthesis are similar across species while the conventional 400–700 nm definition may need modification — the reason a spectrum is described numerically rather than by product category.
Where a source could not be confirmed as publicly accessible, the claim it would have supported has been written as a lower-certainty statement rather than given a citation. Planning ranges remain starting points for your own trials — they are not guarantees of performance, and no figure on this page is a quotation.
Industry FAQ
Specific follow-up questions about this application, answered directly and then explained.
Send the growing area, crop and stage, target PPFD or DLI, ceiling or layer height and your market requirements. We will come back with a fixture proposal, a layout suggestion and the documentation you need to evaluate it.