
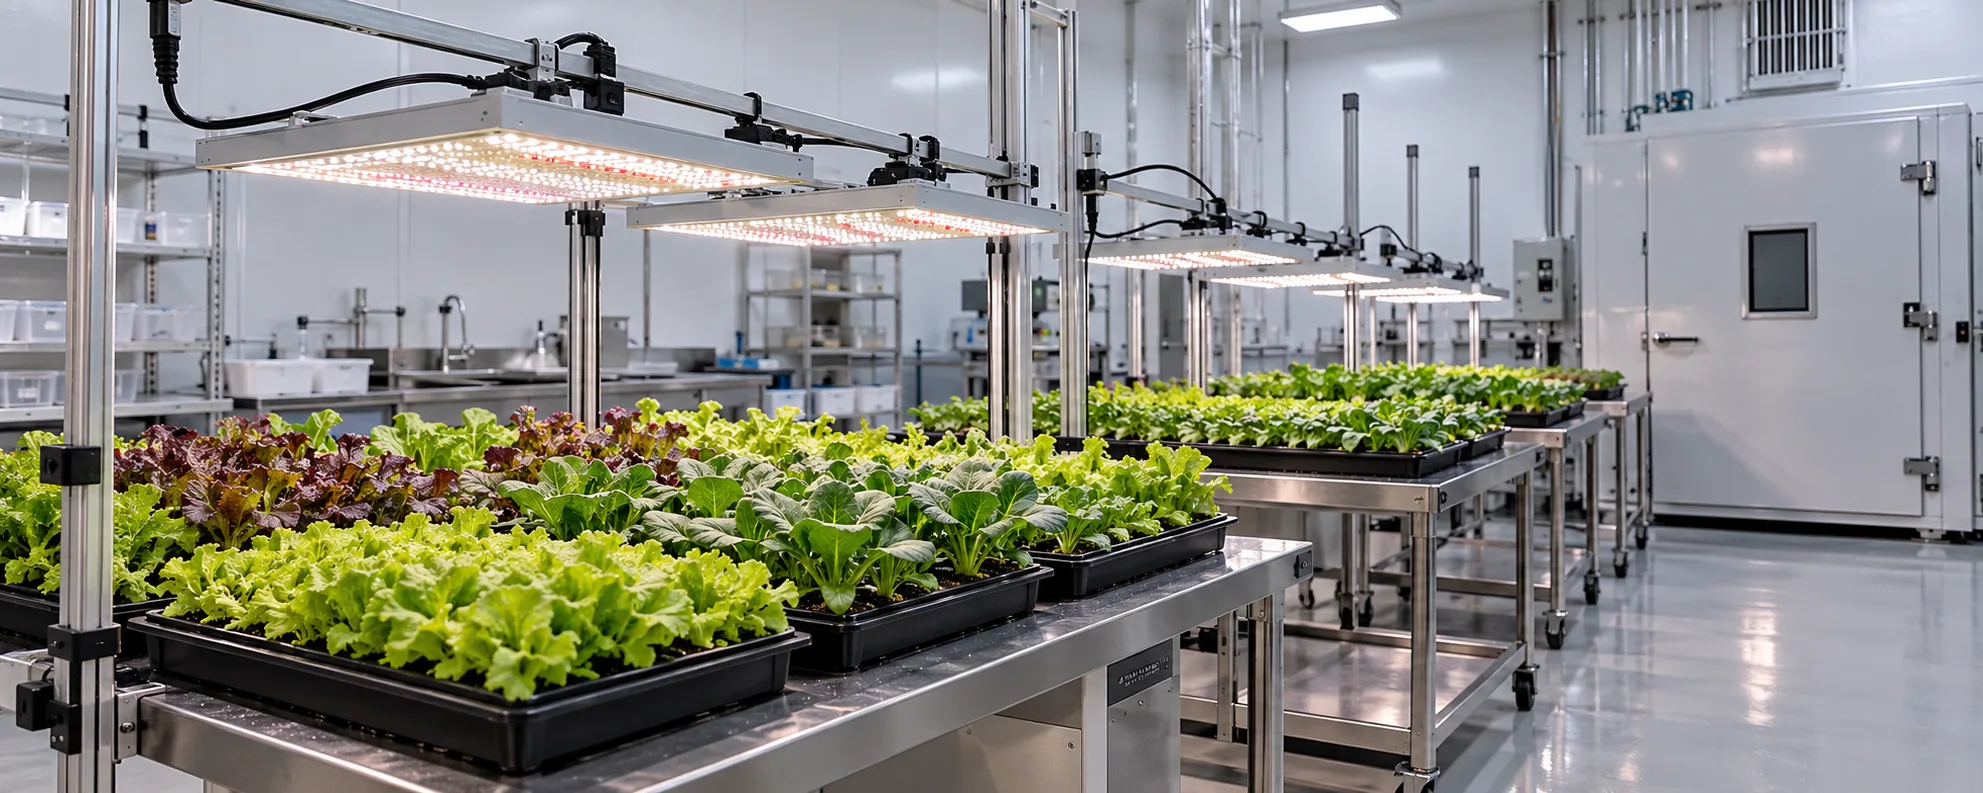
Measurement is where research light quality is won or lost. A growth chamber can look uniform and still vary by 20 percent from shelf to shelf, and an uncalibrated sensor can shift a whole dataset. This article covers how to measure PPFD and efficacy (PPE) so your chamber numbers are trustworthy and comparable. It pairs with the spectrum research article on treatment design.
Measure PPFD, map the chamber
PPFD is the instantaneous photon flux at the canopy plane. In a chamber you must map it: take readings on a grid across each shelf and at the heights plants actually occupy, because chamber reflection and fixture position create gradients. Report the average and the coefficient of variation so readers know how uniform the treatment really was.
| Reading | Why it matters |
|---|---|
| PPFD per grid point | Reveals gradients and hot/cold spots |
| Average PPFD | The treatment level actually delivered |
| Coefficient of variation | How uniform the chamber was |
| Sensor calibration date | Confidence in the numbers |
Efficacy (PPE) compares fixtures fairly
PPE — photons per joule — lets you compare how efficiently two fixtures deliver light, independent of their power rating. In a chamber context it is most useful when specifying or replacing fixtures: a higher PPE means more PPFD for the same electrical input. Measure PPFD and input power together to compute it.
Calibrate before you trust
An uncalibrated or stale quantum sensor can bias every reading in a study. Record calibration date and, where possible, cross-check against a reference sensor.
Turn measurements into comparable numbers
To compare chambers or fixtures, reduce the data the same way: same grid density, same plane height, same averaging. Inconsistent mapping is the silent source of "results that will not replicate." The PPF vs PPFD vs PPE guide explains the units in depth.
- Map PPFD on a grid at plant height, per shelf.
- Report average and CV, not a single reading.
- Record sensor calibration date.
- Compute PPE from measured PPF and input power.
- Use consistent mapping across chambers for comparison.
| Fixture A | Fixture B | Compare by |
|---|---|---|
| Measured PPFD | Measured PPFD | Equal light level |
| Input power | Input power | Compute PPE |
| Fixture age | Fixture age | Account for drift |
| Chamber | Chamber | Map identically |
Worked example: calculating PPE from your own measurements
Fixture efficacy (PPE) is photosynthetic photon flux divided by electrical power: PPE = PPF / W. Datasheets state it, but research chambers should trust their own measurement chain. This illustrative walkthrough shows the arithmetic and the pitfalls.
- Measure fixture PPF: either with a calibrated spectroradiometer under an integrating condition, or by grid-sampling PPFD at the working distance and integrating over the lit area (an estimate with stated uncertainty, not a lab value).
- Measure electrical power at the fixture input with a true-RMS power meter, not at the wall after unknown losses.
- Divide: a fixture delivering 640 umol/s while drawing 240 W has PPE = 640 / 240 = 2.67 umol/J.
- Repeat at the drive levels used in treatments; PPE falls at low output for many fixtures, and treatments running at 20 percent output should report efficacy there.
- Record everything: sensor model and calibration date, distance, grid size, integration method and uncertainty.
The distinction that matters: grid-sampled PPF is an estimate whose uncertainty grows with sparse grids and reflective surroundings, while integrating-sphere or goniometer values are measured lab values. Papers and internal reports should say which one a number is. A PPE figure stated to three decimal places from a 9-point grid is precision theatre, not accuracy.
PPFD measurement practice in chambers
Sensor choice and calibration
Quantum sensors approximate photosynthetically active radiation across 400-700 nm, but response curves differ between models, and LED spectra (with sharp peaks) can expose those differences. For routine monitoring a single well-maintained quantum sensor per chamber is usually adequate; for spectrum research, a spectroradiometer is the reference tool because it sees the actual spectral distribution. Calibrate on a schedule, store calibration certificates, and keep one reference sensor reserved for cross-checks so a drifting sensor is caught before a season of data is biased.
Grid sampling that supports the conclusions
A PPFD map is a spatial dataset: decide the grid before measuring (typically 0.3-0.5 m spacing at canopy height in chambers), record every point, and report the average, minimum and the min-to-avg ratio. Re-map whenever geometry changes, because a map belongs to a fixture-and-chamber configuration, not to the room. Treatments that assume uniformity without mapping inherit a hidden variable.
Questions to ask before you buy
- Does the supplier provide independent photometric test reports (not only datasheet values)?
- Are fixtures individually serialised with factory calibration data for traceability?
- What is the stability of output over time and across thermal cycles, stated as drift specifications?
- Is flicker performance documented, since some sensors and high-speed imaging are sensitive to it?
- Can the fixture output be verified in situ against your reference instruments before acceptance?
Common mistakes in PPFD and PPE measurement
Measurement errors rarely announce themselves; they arrive embedded in the dataset. The recurring ones:
- Using one sensor model across chambers without cross-calibration, so inter-chamber comparisons inherit the offset between sensors.
- Sampling PPFD at one point and calling it the chamber average, in a space where the true spread can exceed 20 percent.
- Reporting PPE from a datasheet at conditions (temperature, drive current) the chamber never uses.
- Ignoring angular response of the sensor; low-angle light from bar fixtures at close mounting stresses sensors differently than overhead arrays.
- Measuring with fixtures new and reporting them old (or the reverse), since output drifts over the first hundreds of hours and over years.
- Confusing units: umol/m2/s for PPFD, umol/J for PPE, mol/m2/day for DLI; papers still blur them.
A reference-grade measurement chain on a practical budget
The instrument hierarchy
A practical chain has three tiers: one spectroradiometer as the reference instrument (used sparingly, calibrated formally), one or two calibrated quantum sensors as transfer standards (cross-checked against the spectroradiometer quarterly), and the working sensors deployed per chamber (checked against the transfer standard on a schedule). The hierarchy converts calibration from an annual scramble into a routine, and it gives every number in the dataset a traceable ancestry.
Uncertainty as part of the result
A PPFD or PPE number without a stated uncertainty is a claim, not a measurement. Stating uncertainty does not require a metrology laboratory: a 9-point grid gives a spatial spread, sensor calibration gives an instrument error, and their combination gives an honest band. Writing 250 plus-or-minus 8 umol/m2/s costs one line and changes how the number can be used; omitting it invites readers to treat an estimate as a fact.
| Instrument | Role | Calibration | Cross-check | Notes |
|---|---|---|---|---|
| Spectroradiometer | Reference | Annual, certified lab | Quarterly internal | Spectral distributions archived |
| Quantum sensor A | Transfer standard | Annual | Vs reference, quarterly | Used for working checks |
| Quantum sensors B-F | Chamber duty | Cross-check schedule | Vs transfer standard | One per chamber |
| Power analyser | Electrical | Annual | Vs known load | True-RMS at fixture input |
Acceptance testing new chamber fixtures
New fixtures enter a measurement chain already in use, and the acceptance test is where their behaviour joins the documented record. A practical acceptance sequence:
- Burn in for the manufacturer-recommended period (commonly 100 hours) before trusting any output figure.
- Measure PPF and PPE at the drive levels the planned treatments use, not only at maximum.
- Map PPFD on the standard grid at the working distance, and file the map with the chamber record.
- Sweep the dimming range and record output versus signal; nonlinearity at the low end matters for low-PPFD treatments.
- Cross-check the chamber working sensor against the transfer standard under the new fixtures, since spectra differ from the old installation.
- File serial numbers, photometric reports and the measured data in the recipe template the chamber uses.
The sequence costs half a day per fixture type and prevents the two classic failure modes: a chamber that was never what its recipe claimed, and a dataset whose early cycles ran on hardware that settled down mid-study. Both are invisible at the time and expensive in review.
References you can verify
- DesignLights Consortium - horticultural lighting technical requirements and testing
- Cornell University - plant science research infrastructure
- e-GRO - measurement and lighting methodology notes
Frequently asked questions
One reading enough?+
No. Chambers are not uniform. Map a grid at plant height and report average and CV.
Why report coefficient of variation?+
It tells readers how uniform the treatment was; a high CV means plants saw different light than the average suggests.
How is PPE useful in research?+
It compares fixture efficiency independent of wattage, useful when specifying or replacing chamber lights.
Does sensor calibration matter?+
Yes — stale sensors bias data. Record calibration date and cross-check if possible.
How do I compare two chambers?+
Map both identically and compare the reduced numbers; do not assume equal delivery from equal settings.
What plane height do I measure?+
The height plants actually occupy during the experiment, not the chamber floor or shelf surface.
Setting up chamber measurement?
We help design a mapping protocol and compute PPE for comparable chamber data.
Get a Grow Light Solution