
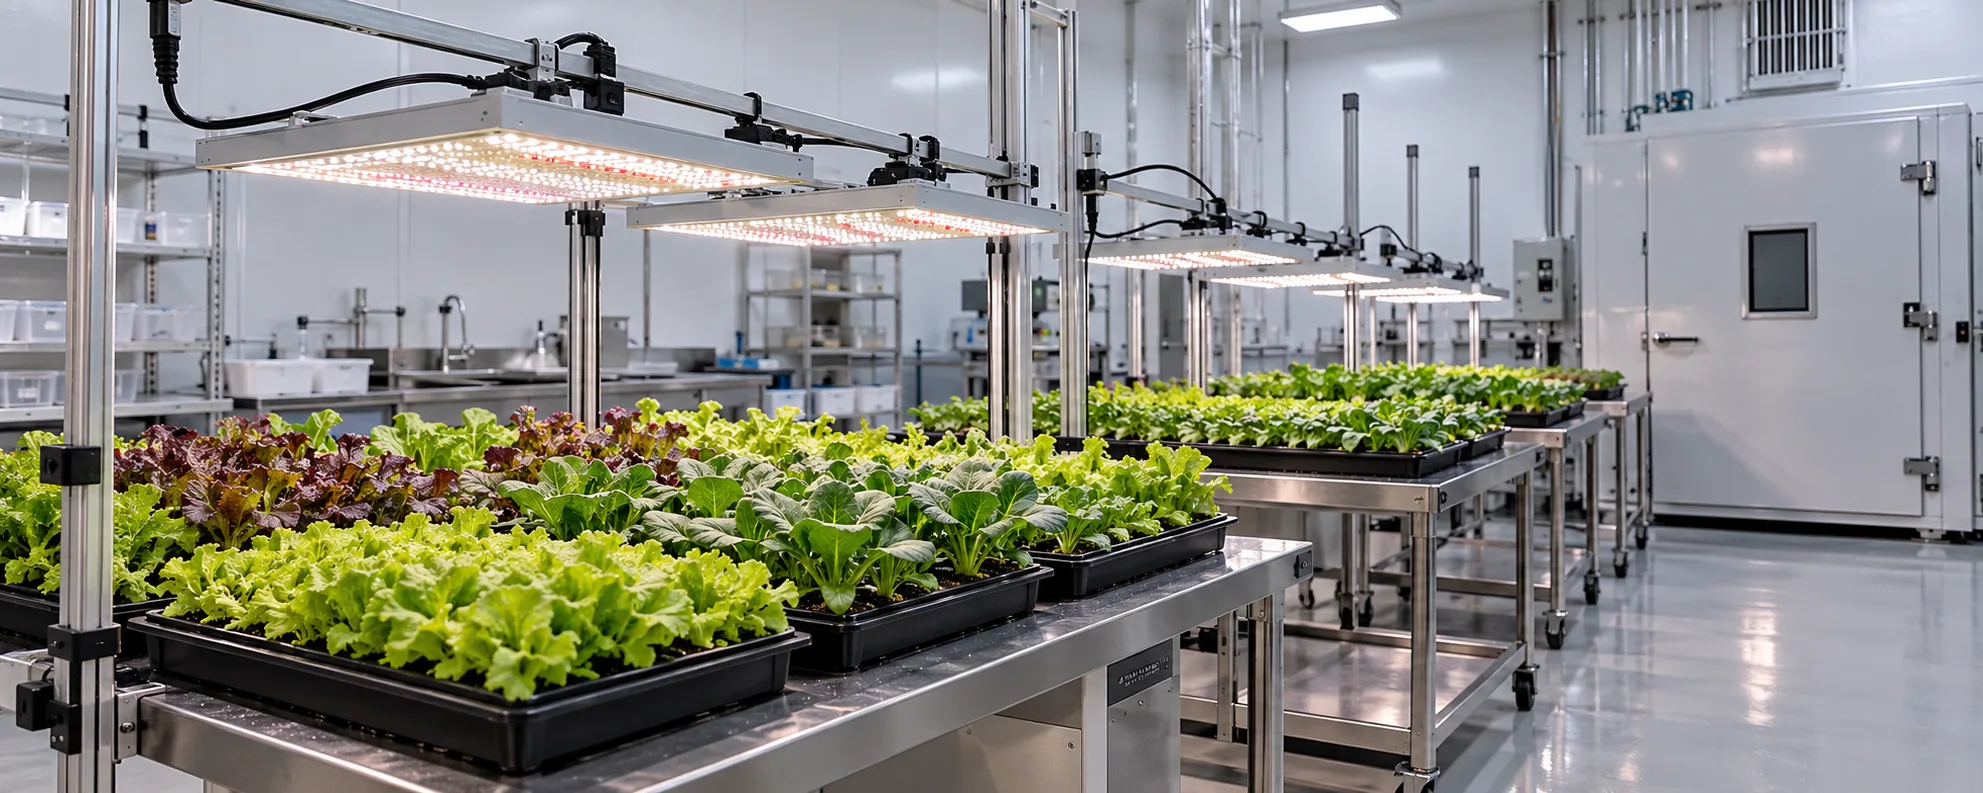
In plant-science research, a "light treatment" is only as good as it is defined and reported. The difference between a result that replicates and one that does not is usually whether the spectrum, intensity and photoperiod were specified precisely and whether what was delivered was actually measured. This article covers how to design LED light treatments so the light variable is unambiguous. The horticultural research industry page covers the broader method.
Define the spectrum, not the colour name
Research treatments should specify the actual spectral power distribution — the irradiance at each wavelength band — not a marketing label like "full spectrum." Report peak wavelengths and the relative contribution of blue, red, far-red and any other band. Two fixtures with the same colour name can have very different spectra, which silently confounds a study.
| Parameter | Report as |
|---|---|
| Blue peak | e.g. ~450 nm, relative flux |
| Red peak | e.g. ~660 nm, relative flux |
| Far-red | e.g. ~730 nm, relative flux |
| White component | Phosphor contribution, if any |
| Total PPFD | Measured at canopy |
Isolate one variable at a time
The cleanest spectrum experiment changes one thing — say, the red:far-red ratio — while holding PPFD, photoperiod and all else constant. If you also change intensity, you cannot tell which effect was spectral. Holding total PPFD equal across treatments is the discipline that makes a spectral comparison meaningful.
Equal PPFD, different spectrum
A valid spectral comparison holds total photon flux constant and varies the band mix. If treatments also differ in PPFD, the intensity effect confounds the spectrum effect.
Report what was delivered, not what was set
Fixtures drift and chambers differ. The published method should state the measured PPFD and spectrum at the canopy during the experiment, not just the dial setting. This is the same principle as logging a commercial recipe — a result is only reproducible if the light it used is documented.
- Specify spectral power distribution, not colour names.
- Hold total PPFD constant when comparing spectra.
- Keep photoperiod and environment equal across treatments.
- Measure and report delivered PPFD and spectrum.
- Log fixture model, drive current and age.
References
- MSU Extension / e-GRO — lighting research methods
- University of Arizona CEAC — controlled environment research
- Cornell University — plant science
| To compare | Hold constant |
|---|---|
| Red:far-red ratio | Total PPFD, photoperiod |
| Blue fraction | All else equal |
| White component | PPFD and environment |
| Any band mix | Total photon flux |
Designing a spectrum treatment worth publishing
A spectrum experiment is only as credible as its controls. The most common weaknesses in chamber spectrum studies are not in the findings but in the setup: treatments that differ in more than spectrum (intensity drifts with channel mix), missing replication across chambers, and undocumented spectral power distributions that make reproduction impossible. Addressing these before the first seed is planted costs little; addressing them after review costs the study.
- Define treatments as full spectral power distributions per channel, documented at the working output, not as marketing spectrum names.
- Hold photosynthetic photon flux density constant across treatments by measuring and compensating, because PPFD is usually the stronger variable.
- Randomise chamber positions or rotate trays on a schedule to separate positional effects from treatment effects.
- Replicate at the chamber or shelf level, not only at the tray level, so the experimental unit is not confused with the sampling unit.
- Record the measurement chain: sensor model, calibration date, sampling height and grid.
Spectrum channels and what they let you test
Research-grade fixtures typically expose independently controllable channels (deep blue, white, deep red, far-red) so treatments can be composed rather than chosen from a list. That capability enables the experiments that matter: blue fraction series at constant PPFD, red-to-far-red ratio series, and end-of-day far-red protocols, each with the spectral distribution of every treatment archived. When comparing fixtures across labs, the published per-channel SPD plus drive settings is what makes a recipe transferable; a photo of a spectrum is not.
One practical note on intensity: channel mixing changes fixture efficiency, so two treatments at the same control percentage are rarely at the same PPFD. Measure PPFD per treatment after mixing, and report the measured values. The distinction between setpoint and delivered spectrum is exactly the kind of methodological detail reviewers ask about.
Questions to ask before you buy
- Are per-channel spectral power distributions published at multiple drive levels?
- What is the dimming resolution and low-end stability, since low-PPFD treatments need it?
- Is channel control scriptable (API or documented protocol) for automated treatment schedules?
- Does the fixture hold spectrum constant across dimming, or does the SPD shift with output?
- What are the optical options (bars, panels, reflectors) for matching chamber geometry?
Common mistakes in chamber spectrum research
Spectrum studies accumulate methodological debt quickly because every channel adds a dimension. The mistakes reviewers encounter most:
- Treatments defined by controller percentages rather than measured spectral distributions, which are not comparable across fixture models.
- PPFD allowed to drift between spectrum treatments because channel mixing changes output; the spectrum effect is then confounded with intensity.
- Chambers treated as replicates when they are blocks, or trays treated as replicates when the chamber is the experimental unit.
- No positional randomisation, so the tray nearest the door becomes a permanent member of one treatment.
- Spectral distributions reported only at installation and never re-measured, though LEDs and drivers drift over years.
- Findings reported without the environmental context (temperature, CO2, humidity) that modulates light-use efficiency.
From pilot to dataset: scaling spectrum work sensibly
Pilot before programme
A two-treatment pilot (a control and one contrast) run cleanly is worth more than a five-treatment factorial run once with uncontrolled drift. The pilot surfaces the practical constraints: how much tray-to-tray variation exists at constant settings, how long a cycle fits the schedule, where sensors disagree. Those constraints size the real programme; skipping the pilot sizes it by optimism instead, and the correction arrives as a failed season.
Data discipline across cycles
Spectrum programmes succeed on boring consistency: same sensor chain, same calibration schedule, same map grid, same recipe format, cycle after cycle. Every deviation needs a note in the record, because reviewers and collaborators will ask what changed. When a programme runs this way, the accumulated cycles form a dataset that supports claims no single run can make; when it does not, each cycle is an island and the programme produces anecdotes.
| Treatment | Channel SPD archived | Measured PPFD (umol/m2/s) | Photoperiod (h) | Chamber | Calibration date |
|---|---|---|---|---|---|
| Control | Yes (file 0412) | 250 | 16 | C-1 | Sensor 7: March |
| +Blue | Yes (file 0413) | 250 | 16 | C-2 | Sensor 8: March |
| +Far-red EOD | Yes (file 0414) | 250 | 16 + EOD | C-3 | Sensor 9: March |
| Position control | As control | 250 | 16 | Rotated trays | Sensor 7: March |
Choosing spectrum treatments that answer a real question
Treatment design is where spectrum research earns or loses its value. Three patterns cover most useful questions:
- Dose-response series: one channel or region varied in steps (for example blue at 10, 20, 30 percent) at constant PPFD, answering how much before asking why.
- Replacement series: total photon flux held constant while two regions trade share, answering whether the crop responds to the ratio or only to the total.
- Timing protocols: identical spectra delivered with different timing (end-of-day far-red, night interruption, pulsed delivery), answering when the response gate is open.
Each pattern needs the same skeleton: documented distributions, mapped and equal PPFD across treatments, replication at the chamber level, and pre-agreed response variables. The common failure is combining patterns in one run (varying share, total and timing at once), which produces results that describe a specific event rather than a generalisable response. Run the patterns separately, and the findings compound across studies instead of cancelling inside one.
A final practical note: publish or archive the measured distributions with the treatment definitions. The next study that builds on yours can then reproduce the photons rather than the settings, which is the only reproduction that actually tests the finding.
References you can verify
- Cornell University - plant science and controlled environment research
- Controlled Environment Agriculture Center, University of Arizona
- e-GRO - lighting research summaries for CEA
Frequently asked questions
Why not just say "full spectrum"?+
That label hides the actual spectrum. Two "full spectrum" fixtures can differ enough to confound a study. Report the distribution.
How do I compare spectra fairly?+
Hold total PPFD equal and vary only the band mix, with all else constant.
Should I report the dial setting?+
Report measured delivered PPFD and spectrum; the setting alone is not reproducible because fixtures drift.
Does fixture age matter?+
Yes — output changes with age and temperature. Log model, drive current and age so results can be reproduced.
What is the minimum I must report?+
Band peaks and relative flux, total measured PPFD, photoperiod, and the fixture details. More is better.
Can I compare across chambers?+
Only if you measure light in each chamber; chamber geometry changes delivery. Measure, do not assume equivalence.
Designing a light treatment?
We help specify spectra and report delivered light for reproducible plant-science trials.
Get a Grow Light Solution